Figures & data
TABLE I Present and Target Parameters of the Laser Systems at ELI Beamlines
TABLE II Experimental Station at ELI Beamlines Expected to Produce Ionizing Radiation
TABLE III Maximum Legal Exposure Limits for Radiation Workers in the Czech RepublicCitation27 and ELI Beamlines Internal Limits*
Fig. 1. Monte Carlo estimation of the H*(10) rate in the LUIS experimental hall. An electron beam with a peak energy of 400 MeV with 100 pC per pulse was used as the source term for this study. No additional shielding is installed between LUIS and the control room. Radiation leaks through the floor penetrations toward the control room.
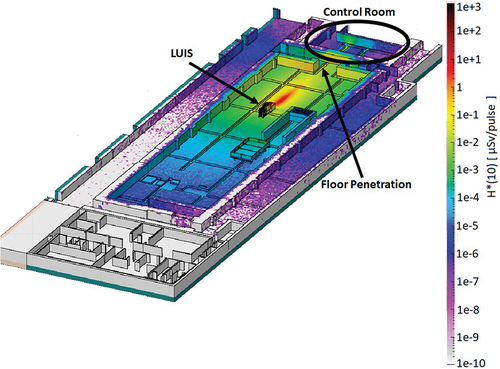
Fig. 2. Monte Carlo estimation of the H*(10) rate in the LUIS experimental hall. An electron beam with a peak energy of 400 MeV with 100 pC per pulse was used as the source term for this study. A concrete shielding wall is shown in the figure. The H*(10) rate reduction in the control room is of two orders of magnitude (compared with ).
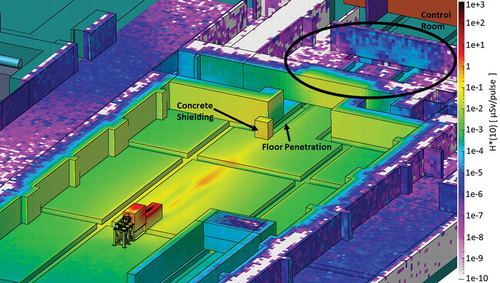
Fig. 3. Picture of the floor penetration in the LUIS experimental hall (a) without and (b) with concrete blocks. The same set is installed on the control room side of the penetrations, but inverted, thus forcing juggled routing of the cabling. These concrete blocks are a redundant shielding easily added in compliance with the ALARA principle (see Sec. IV).
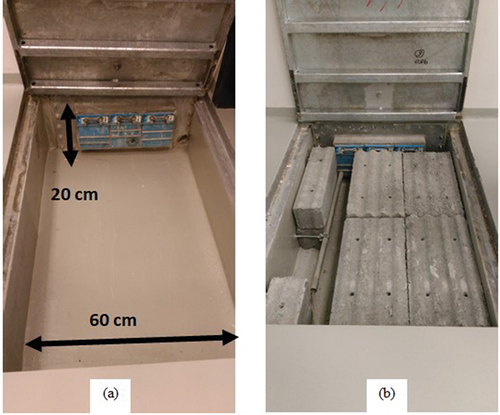
Fig. 4. Monte Carlo ambient dose equivalent rate outside the exit window of the ALFA interaction chamber assuming an electron beam with 3.5-MeV average energy and 2.5-MeV full-width at half maximum. The beam divergence was set to (a) 12 mrad and (b) 100 mrad.
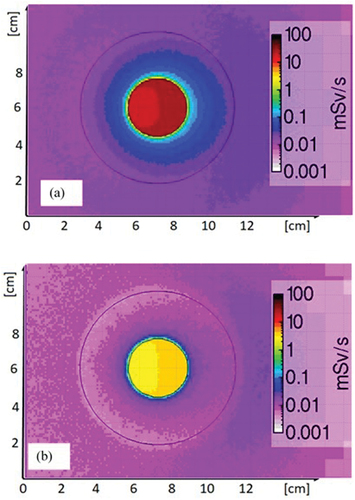
Fig. 5. HEH fluence in the E3 experimental hall for a solid target experiment driven by the L4-ATON laser, estimated via FLUKA simulations.
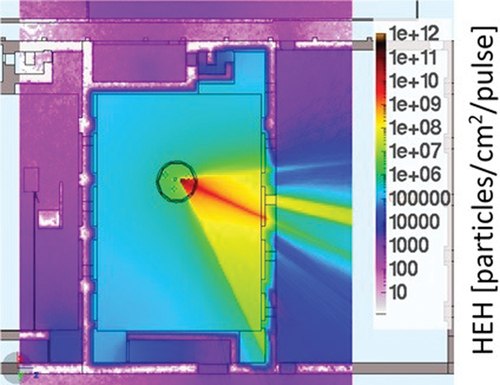
Fig. 6. Si-1 MeV neq fluence in the E3 experimental hall for a solid target experiment driven by the L4-ATON laser, estimated via FLUKA simulations.
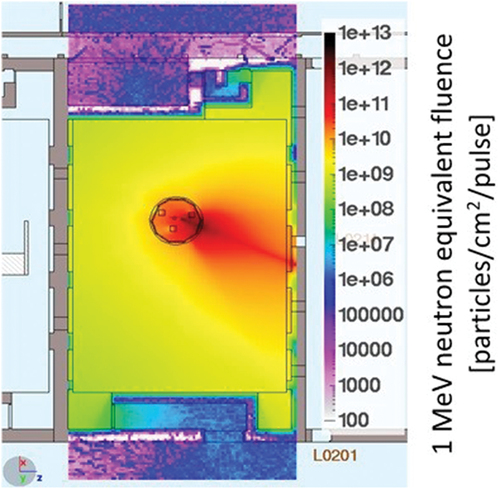
Fig. 7. Operators at work on the laser system. Clean room ISO 7 attire and laser-safety goggles limit movement and visibility, increasing the time needed for each intervention, and consequently, the exposure time.
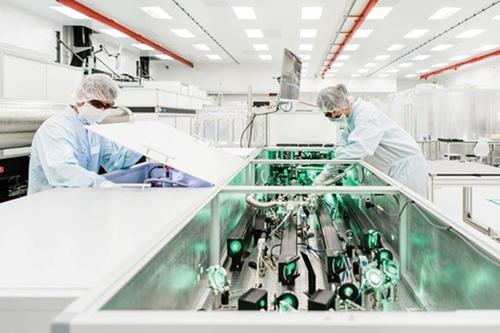
Fig. 8. FLUKA geometry model of the experimental halls at ELI Beamlines. This corresponds to the basement in .
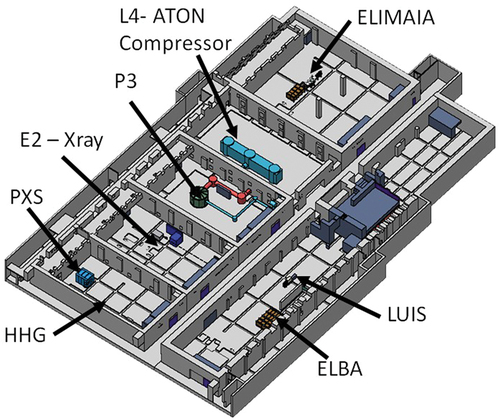
Fig. 9. Diagram of the Laser building, indicating the locations of the main technological units.
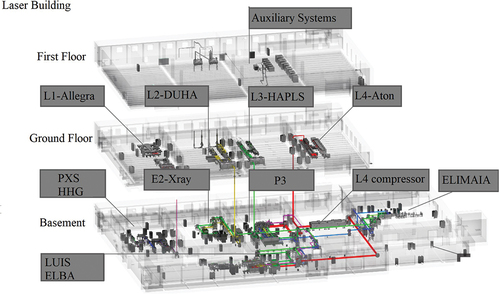
Fig. 10. H*(10) rate simulated in an experimental hall hosting a 500-MeV electron source and 1800 shots per day (vertical view). The corridor and control room are treated as a normal workplace, i.e., personnel will be present for daily 8-h shifts.Citation54
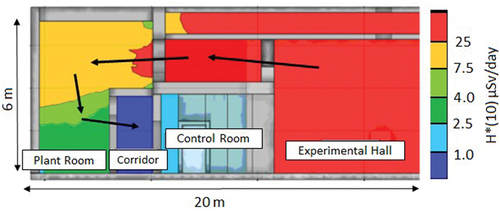
Fig. 11. Residual dose rate studies of the first quadrupole of ELIMAIA after 1 year of operation and 1 h of cooldown time. H*(10) rates in its proximity are significant. Extra shielding in this area was deemed necessary during maintenance and upgrade periods (see ).
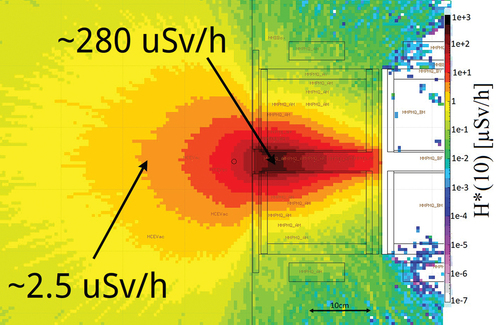
Fig. 12. Residual dose rate studies of the first quadrupole of ELIMAIA after 1 year of operation and 1 h of cooldown time with stainless steel shielding. H*(10) rates are significantly reduced with respect to the scenario without the shielding (see ).
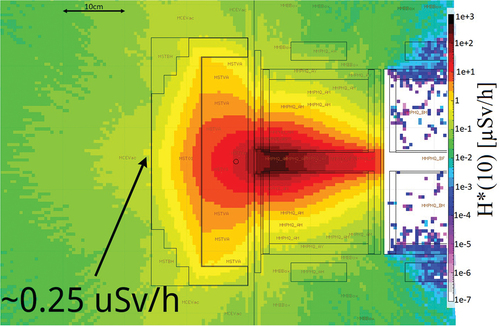
Fig. 13. View of an experimental hall. Alarms, panels, and detectors are highlighted.
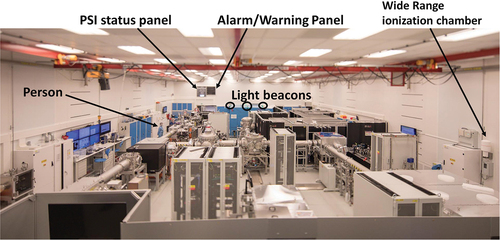
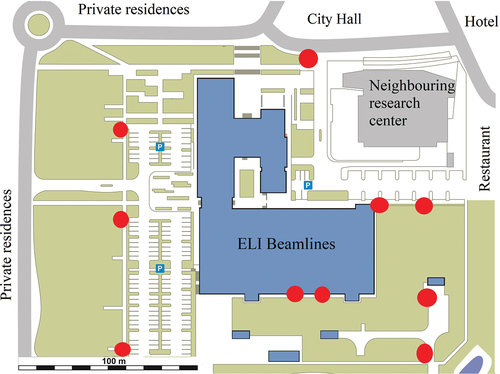
Fig. 14. ELI Beamlines buildings and surrounding areas. The red dots mark the 10 environmental measuring points.