Figures & data
Table 1. Descriptive statistics, Mean (M), Standard Deviation (SD), Skewness (Ske) and Kurtosis (kurt) for the measurements.
Table 2. Independent sample t-test – gender differences.
Table 3. Independent sample t-test – primary vs lower secondary school level.
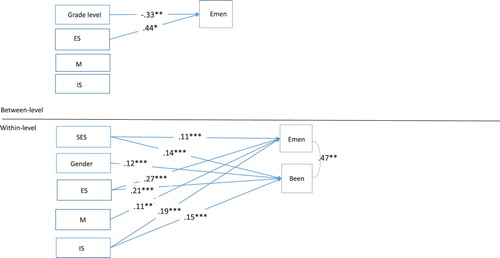
Figure 1. The associations between teachers’ monitoring, emotional and instructional support and SE.