Figures & data
Table 1. Questions selected measuring attitudes towards nature and the environment.
Figure 1. PCA analysis showing the relationship between the two main Principal Components and the 14 items concerning Environmental attitudes. The arrows reflect the items as labelled in . The clear separation of the items into two groups along the x-axis (D1) supports the characterization of the items as pertaining to either Utilization (to the left) or Preservation (to the right).
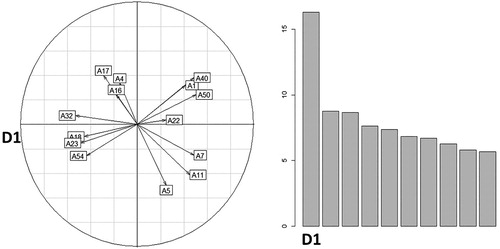
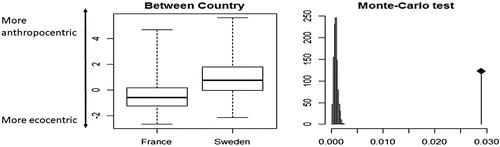
Figure 2. Overall differences between the environmental attitudes in Sweden and France—Between-class analyses. The difference between Swedish and French samples is significant (p < 0.001; Monte-Carlo test).