
Figures & data
Figure 1. Expected Relationships Between Teachers’ Perceptions of the State of Democracy in Their Schools and Related Predictors.
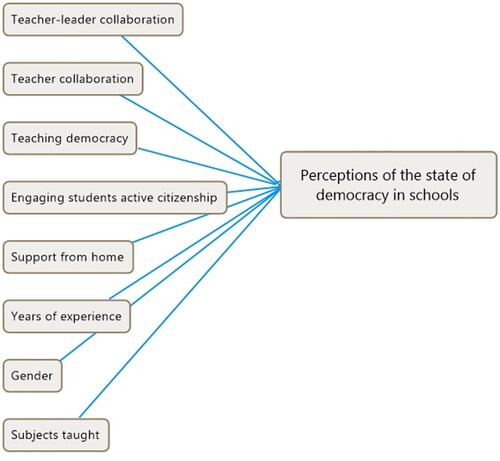
Table 1. Descriptive statistics, reliabilities, and bivariate correlations.
Table 2. Coefficients of regression with teachers’ perceptions of the state of democracy as the dependent variable (n=206).