
Figures & data
Figure 1. IKO Abridged theory of action.
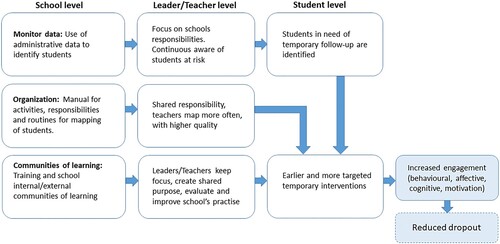
Table 1. Annual activities and responsibilities of the IKO model.
Table 2. Missing values in experimental and control conditions, % (n).
Table 3. Characteristics by experimental and control condition.
Table 4. Student-level variables by experimental condition.
Table 5. Effect of the IKO model. All students.
Table 6. Effect of the IKO model. At-risk students.