Figures & data
Figure 1. The review process at SIER.
Table 1. The key theoretical resources.
Table 2. The theoretical congruity between aggregation/configuration, formalisation/professional judgment, and the levels of analytic progress and abductive steps.
Table 3. The abductive process.
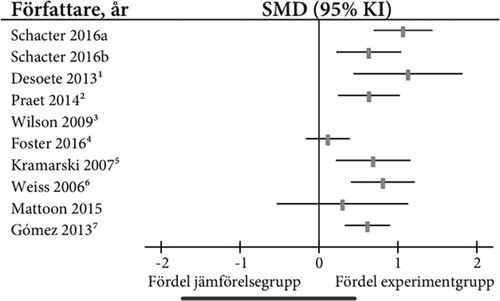
Figure 2. SIER’s example of a forest plot diagram, which differs from conventional forest plot diagrams in that no aggregated effect size is reported (SIER, Citation2017a, p. 16). The picture is reproduced from SIER, with permission.