Figures & data
Figure 1 Government population policies with respect to fertility in different regions of the world, selected years 1976–2015
Source: UN, World Population Policies database, https://esa.un.org/PopPolicy/about_database.aspx.
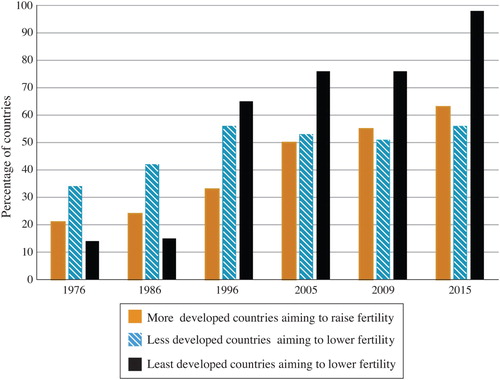
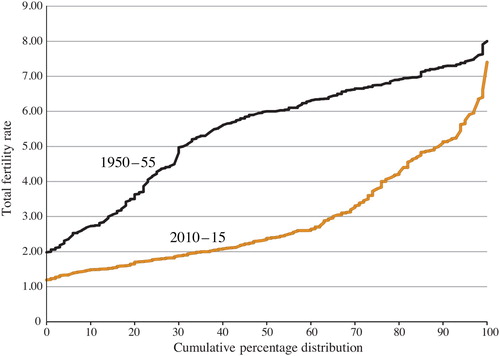
Figure 2 TFR distribution for all countries in the world as registered by the UN, 1950–55 and 2010–15
Source: UN (Citation2017), N = 200 countries.