
Figures & data
Figure 1 Racial differences in the proportion of individuals remaining childless at age 40+: men and women from the US NLSY79 Cohort
Notes: Calculations are based on the 10,571 individuals (men = 5,346; women = 5,225) whose BMI was measured during early adulthood. When early childbearers are excluded from the sample, the average proportion of childless individuals is overestimated and its racial/ethnic distribution changes, especially in women. The proportions are 0.26, 0.24, and 0.25 for Black, Hispanic, and White men respectively, and 0.28, 0.19, and 0.23 for Black, Hispanic, and White women, respectively, if early childbearers are excluded. The proportions become lower if early childbearers are included, to 0.20, 0.20, and 0.19 for Black, Hispanic, and White men, respectively, and 0.17, 0.11, and 0.18 for Black, Hispanic, and White women, respectively.
Source: Authors’ analysis of data from the NLSY79 Cohort.
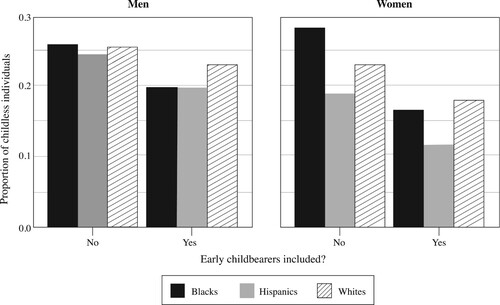
Figure 2 A directed acyclic graph describing the expected causal process linking race/ethnicity, early BMI, and childlessness in our study
Notes: In our proposed causal framework, causal paths (thick lines) exist between exposure (early BMI) and outcome (childlessness), as well as between exposure and mediators. The rest are biasing paths (thin lines). Race/ethnicity and birth cohort are confounders, because they affect both exposure and outcome. To estimate the total effect of early BMI on childlessness, adjustment of confounders is necessary and sufficient, because adjustment of mediators would ‘take away’ the weight of effects exerted through the causal path between early BMI and mediators. In this study, we are interested in the total effect that combines the direct and indirect effects of early BMI, and as such, only race/ethnicity (and birth cohort as a potentially competing confounder) are adjusted for in the models.
Source: Authors’ own.
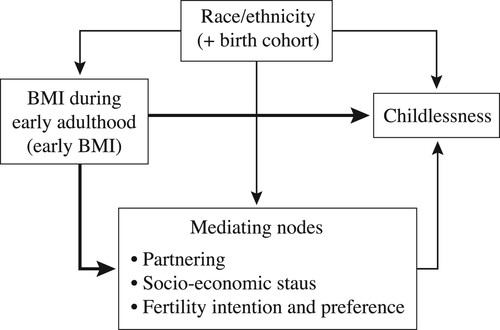
Figure 3 Probability of remaining childless at age 40+ by early BMI and race/ethnicity: women in the US NLSY79 Cohort who were last interviewed at age 40+ (n = 3,765)
Note: Early BMI is pre-parenthood BMI at age 16. The average points of distributions for individuals of healthy BMI are indicated by dashed lines to help gauge relative distances to the distributions of other BMI groups.
Source: As for .
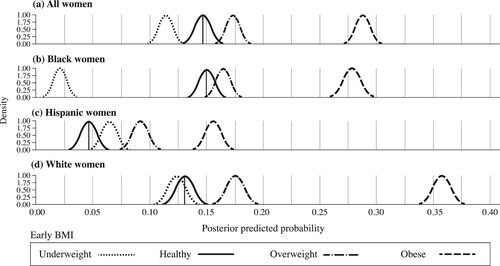
Figure 4 Probability of remaining childless at age 40+ by early BMI and race/ethnicity: men in the US NLSY79 Cohort who were last interviewed at age 40+ (n = 3,766)
Note: Early BMI is pre-parenthood BMI at age 16. The average points of distributions for individuals of healthy BMI are indicated by dashed lines to help gauge relative distances to the distributions of other BMI groups.
Source: As for .
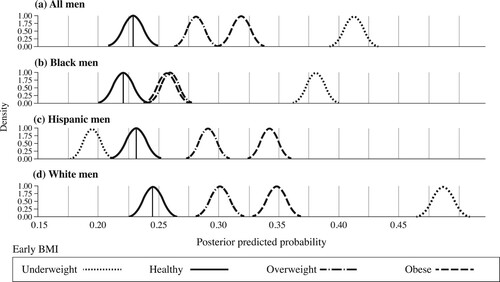
Figure 5 Survival curves for time to first parenthood by BMI, relative to healthy BMI counterparts, and by race/ethnicity: women in the US NLSY79 Cohort (n = 5,225)
Notes: Survival curves show probability of remaining childless over time. Comparison groups are based on pre-parenthood BMI estimated at age 16. Age at which 50 per cent of women have transitioned to first parenthood is indicated by dashed lines in the panels for All women. Shading shows 95 per cent credible intervals.
Source: As for .
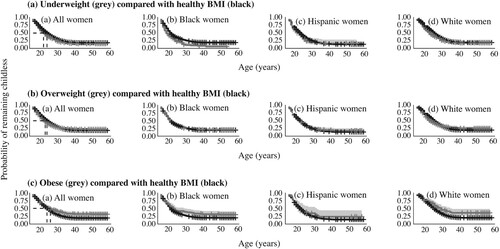
Table 1 Hazard ratio of first birth by early BMI group (relative to healthy BMI): women in the US NLSY79 Cohort
Figure 6 Hazard rate of becoming a parent by BMI, relative to healthy BMI counterparts, and by race/ethnicity: women in the US NLSY79 Cohort (n = 5,225)
Notes: Vertical dashed lines represent the hazard rate for women of healthy BMI. Posterior distributions of estimates were used to calculate hazard rate differences. Negative values indicate a lower hazard rate (i.e. slower transition to first birth) than for those with healthy BMI. Difference in the distribution of estimates reflects the degree of uncertainty around the estimated hazard rate for that BMI group relative to that of the healthy BMI group.
Source: As for .
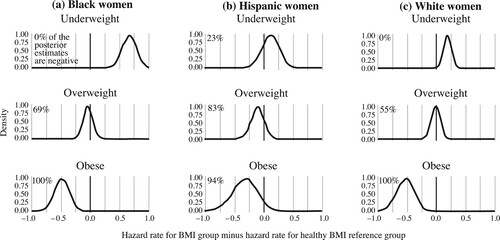
Figure 7 Survival curves for time to first parenthood by BMI, relative to healthy BMI counterparts, and by race/ethnicity: men in the US NLSY79 Cohort (n = 5,346)
Notes: Survival curves show probability of remaining childless over time. Comparison groups are based on pre-parenthood BMI estimated at age 16. Age at which 50 per cent of men have transitioned to first parenthood is indicated by dashed lines in the panels for All men. Shading shows 95 per cent credible intervals.
Source: As for .
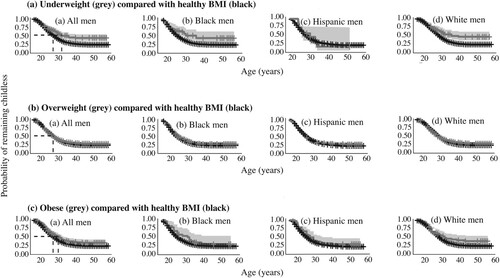
Figure 8 Hazard rate of becoming a parent by BMI, relative to healthy BMI counterparts, and by race/ethnicity: men in the US NLSY79 Cohort (n = 5,346)
Notes: Vertical dashed lines represent the hazard rate for men of healthy BMI. Posterior distributions of estimates were used to calculate hazard rate differences. Negative values indicate a lower hazard rate (i.e. slower transition to first birth) than for those with healthy BMI. Difference in the distribution of estimates reflects the degree of uncertainty around the estimated hazard rate for that BMI group relative to that of the healthy BMI group.
Source: As for .
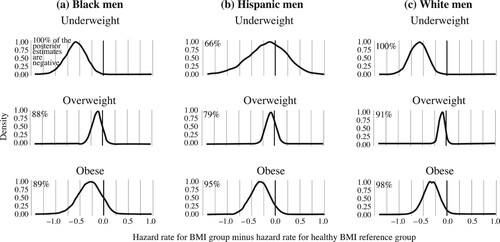
Table 2 Hazard ratio of first birth by early BMI group (relative to healthy BMI): men in the US NLSY79 Cohort