Figures & data
Table 1 Description of analytic samples (full and balanced): China, 2014 and 2018
Table 2 Mean ideal family size, proportion desiring two or more children, and proportion desiring more than actual number of children, by year and treatment status, and difference-in-differences estimates: China, 2014 and 2018
Figure 1 Difference-in-differences estimates of effects of being eligible to have two children on ideal family size, proportion desiring two or more children, and proportion desiring more than actual number of children, overall and by subgroup: China, 2014 and 2018
Notes: All estimates are based on subsets of the full sample and are weighted by cross-sectional weights. Horizontal lines show 95 per cent confidence intervals.
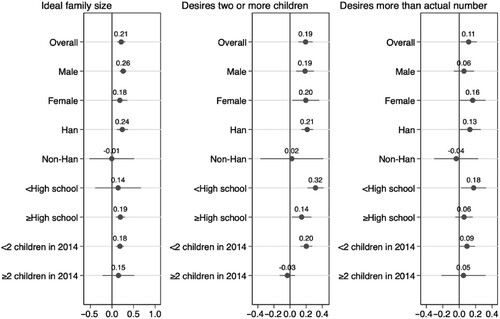
Table 3 Estimates of effects of being eligible to have two children on ideal family size, proportion desiring two or more children, and proportion desiring more than actual number of children, using individual fixed-effects models: China, 2014 and 2018
Figure 2 Fixed-effects model estimates of effects of being eligible to have two children on ideal family size, proportion desiring two or more children, and proportion desiring more than actual number of children, overall and by subgroup: China, 2014 and 2018
Notes: Estimates are based on subsets of the balanced sample. Horizontal lines show 95 per cent confidence intervals. Standard errors (in parentheses) are clustered at individual level.
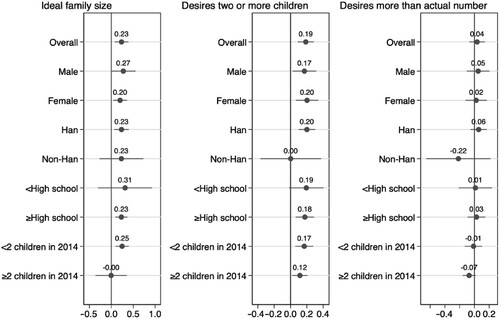
Table A1 Estimates of effects of being eligible to have two children on ideal family size, proportion desiring two or more children, and proportion desiring more than actual number of children, using individual fixed-effects models on imputed data vs complete cases: China, 2014 and 2018
Table A2 Characteristics of individuals in the full sample and by treatment status: China, 2014
Table A3 Estimates of effects of being eligible to have two children on ideal family size, using individual fixed-effects linear vs Poisson models: China, 2014 and 2018
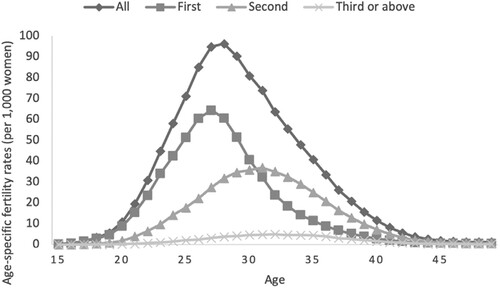
Figure A1 Age-specific fertility rates (per 1,000 women) in China, all births and by birth order, 1 November 2019 to 31 October 2020
Source: 2020 China Population Census.