
Figures & data
Figure 1. The Smart Specialisation framework.
Source: After Balland et al. (Citation2019).
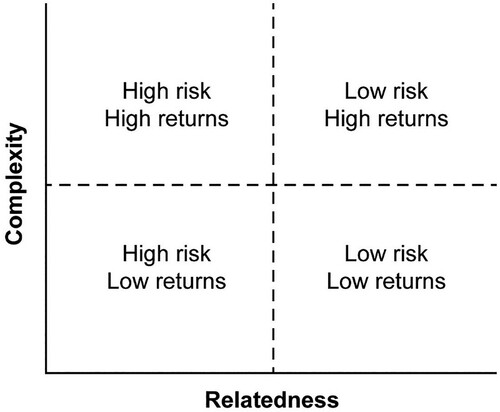
Table 1. Descriptive statistics for sample cities, 2011–15.
Figure 2. Technological relatedness in the European Union knowledge space: (a) 1981–85 and (b) 2011–15.
Note: The eight aggregate Cooperative Patent Classification (CPC) technology classes are: Electronics, Instruments, Chemicals, Biotech, Industrial process, Machinery and transport, Consumer goods and Climate change technologies.
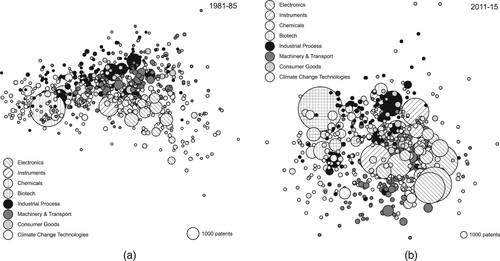
Table 2. Top technology fields by complexity, 2011–15.
Table 3. Complexity scores in European Union cities.
Figure 3. Smart Specialisation in European Union cities by entry and exit, 1981–2015.
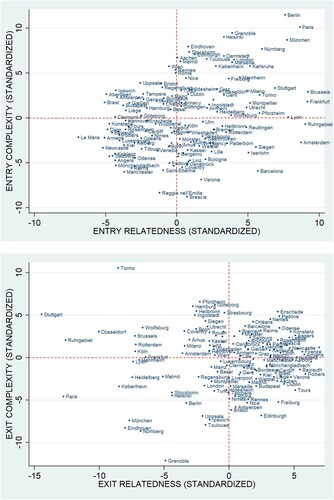
Table 4. Relationship between Smart Specialisation and economic growth.
Table 5. European Union city gross domestic product (GDP) growth and Smart Specialisation (dependent variable: GDP growth).
Table 6. European Union city employment growth and Smart Specialisation (dependent variable: employment growth).