
Figures & data
Figure 1. PATINT and DESINT across five quintiles: averages, 2000–12.
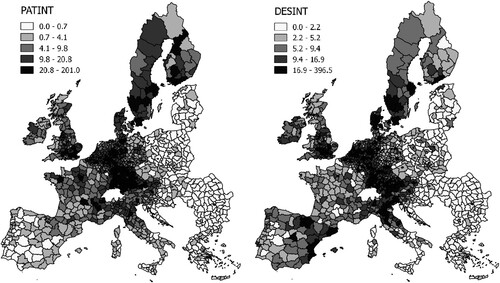
Table 1. Descriptive statistics.
Table 2. Correlation matrix.
Figure 2. Orthogonalized impulse response functions (IRFs): bivariate panel vector autoregression (PVAR).
Note: Graphs are based on the best-fit model selected by the J-test and the model information criteria.
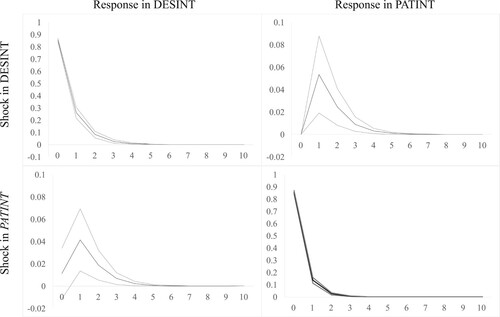
Table 3. Panel vector autoregression (PVAR) bivariate results.
Figure 3. Orthogonalized impulse response functions (IRFs): trivariate panel vector autoregression (PVAR).
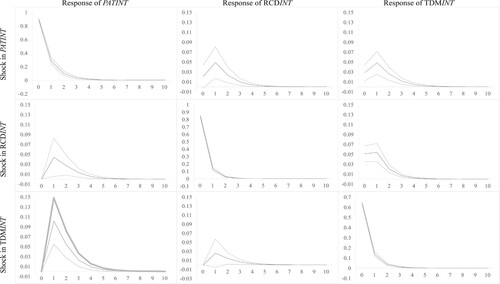
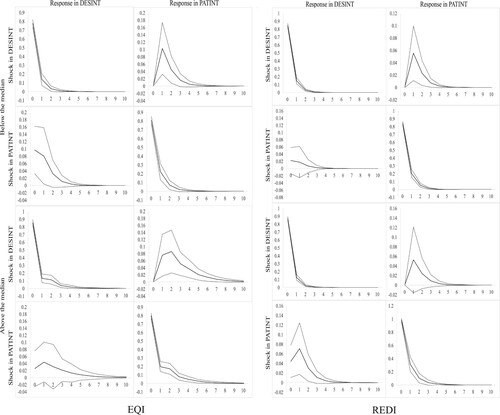
Figure 4. Panel vector autoregression (PVAR) for above and below median quality of government index (EQI) and regional entrepreneurship and development index (REDI) regions.
Supplemental material