Figures & data
Figure 1. ELISA is capable of detecting nucleotide dependent interaction of PfHop with PfHsp70-1. The ELISA representative binding curves for the interaction of PfHop with PfHsp70-1 GGMP and linker variants in the absence of nucleotide (NN) (A) and in the presence of 5 mM ATP (B) or 5 mM ADP (C). The resultant absorbance values obtained at the highest concentration of PfHop were averaged as the maximum (100%) binding for the protein. Bar graphs represent the relative intensity of binding between PfHsp70-1; PfHsp70-1G632, PfHsp70-1G648 and PfHsp70-1L with PfHop under the distinct nucleotide states normalised to PfHsp70-1 in the absence of nucleotides (D). Interaction of PfHop with the PfHsp70-1NBD was used as a baseline. The error bars represent standard errors of the mean obtained from three assays conducted using different batches of purified recombinant protein. Statistical analyses were conducted using a One-way ANOVA (p<0.01).
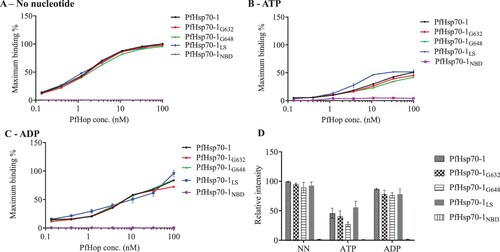
Figure 2. Slot blot data confirmed the compromised capability of the GGMP mutants of PfHsp70-1 to bind PfHop. Various quantities (1, 2, and 4 μg) of PfHsp70-1 or its GGMP mutants were spotted on the nitrocellulose membrane as prey protein. BSA (4 μg) was used as a negative control. Each respective protein concentration was spotted using a vacuum and overlaid with 4 μg of purified PfHop protein (A) and accompanying densitometry analysis. The assay was repeated in the presence of ADP or ATP (B and C) and accompanying densitometry analyses are shown on the right-hand side. α- PfHop antibody was used to detect the presence of bound PfHop. The data were generated from three independent assays. The broken rectangles represent the slot blot space onto which PfHop and BSA were loaded as controls while the panel labelled ‘’null’’ represents absence of loaded bait protein. Standard errors about the mean are indicated, and statistical analysis was conducted using two-way ANOVA (statistical significance at p<0.001* showing the variation of signals of GGMP derivatives of PfHsp70-1 versus wild type PfHsp70-1 with respect to their interaction with PfHop are shown).
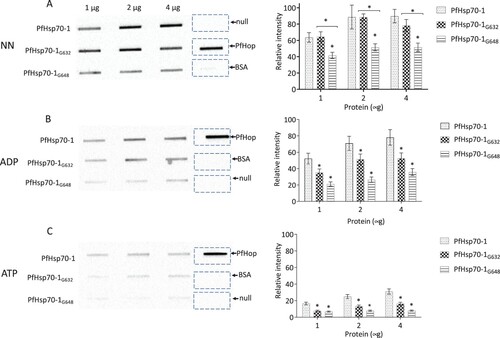
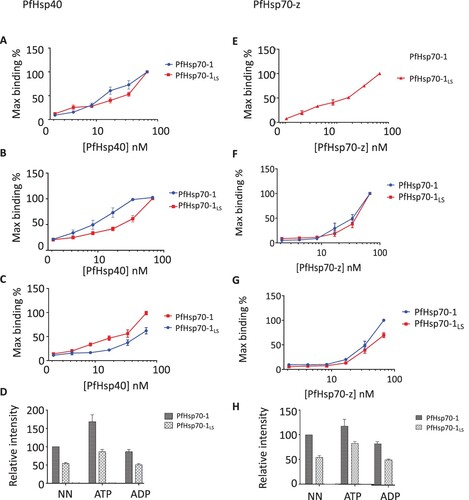
Figure 3. ELISA confirms the compromised affinity of PfHsp70-1LS for both PfHsp40 and PfHsp70-z. Representative ELISA curves for the association between PfHsp40 and PfHsp70-1/PfHsp70-1LS based on assay conducted in the absence of nucleotides (A) or presence of either 5 mM ATP (B) or ADP (C). Bar graphs represent the comparative association of Hsp40 with PfHsp70-1/PfHsp70-1LS as determined by the relative maximum binding in each case compared to the maximum binding of the wildtype PfHsp70-1 in the absence of nucleotides (D). Representative ELISA curves for the association between PfHsp70-z with PfHsp70-1/PfHsp70-1LS in the absence of nucleotide (E), or presence of ATP (F) or ADP (G). Bar graphs represent the relative association of each respective protein as determined by comparing the intensities to the intensity of wildtype PfHsp70-1 in the absence of nucleotide (H). The data is an average from three independent ELISA runs. Statistical analyses were conducted using a one-way ANOVA with a p<0.01.