
Figures & data
Figure 1. Flow chart of the exclusion and inclusion criteria for IBD patients from the IBSEN III study and the Tromsø7 sample. IBSEN: Inflammatory Bowel Disease in South-Eastern Norway; CD: Crohn’s disease; UC: ulcerative colitis; FFQ: food frequency questionnaire; IBD: inflammatory bowel disease; IBS: irritable bowel syndrome.
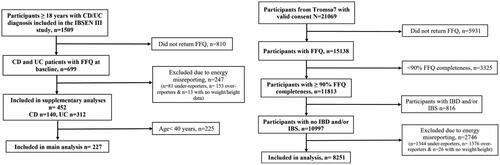
Table 1. Clinical characteristics of IBD patients.
Table 2. Background characteristics of IBD patients and the Tromsø7 sample.
Table 3. Intake of macro- and micronutrients* in IBD patients compared to the Tromsø7 sample and Nordic nutrition Recommendations.
Figure 2. Percentage of IBD patients (n = 227) and the Tromsø7 sample (n = 8251) with intakes not in line with recommendations. *Significant difference between IBD and Tromsø7. IBD: inflammatory bowel disease. E%: energy percent; SFA: saturated fatty acids; MUFA: monounsaturated fatty acids; PUFA: polyunsaturated fatty acids.
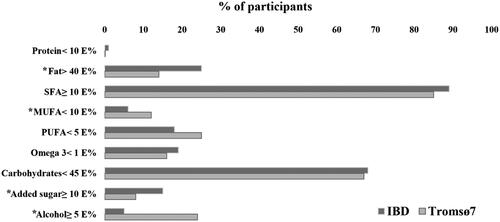
Table 4. Median daily intake of food groups (g/d) in IBD patients compared to the Tromsø7 sample.
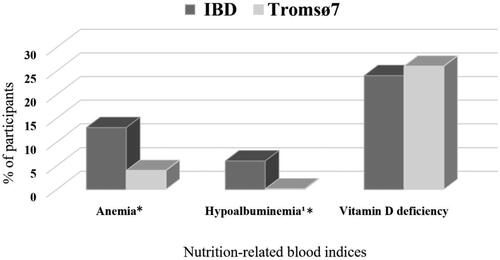
Figure 3. Percentage of IBD patients (n = 227) and the Tromsø7 sample (n = 8251) with suboptimal nutrition-related blood indices. *Significant difference between IBD and Tromsø7, anemia: 99% CI for IBD (0.08, 0.19) and Tromsø7 (0.03, 0.04), hypoalbuminemia: 99% CI for IBD (0.02, 0.11) and Tromsø7 (3.62 × 10ˉ6, 0.005). IBD: inflammatory bowel disease.
Supplemental Material
Download MS Word (67.8 KB)Data availability statement
The data underlying this article cannot be shared publicly due to the privacy of individuals that participated in the study. Data will be shared on reasonable request to the corresponding author.