Figures & data
Table 1. General soil properties in the 0–20 cm soil depth under different forage crop cultivations after four years of forage crop cultivation
Figure 1. Shoot- and root biomass in the four forage crop cultivations during the flowering and maturation phases. Values are means ± standard error (n = 4). Different lowercase and uppercase letters mean significant difference in a given variable during the flowering and maturation phases, respectively. Asterisk (*) means a significant difference between the two growth stages at the level of 0.05 based on t-test
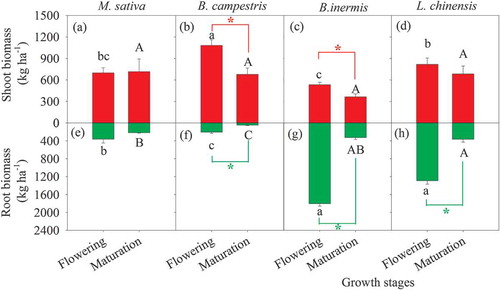
Figure 2. Shoot N concentrations in the four forage crops during the flowering and maturation phases. Values are means ± standard error (n = 4). Different lowercase and uppercase letters mean significant difference in shoot N concentration during the flowering and maturation phases, respectively. Two Asterisks (**) mean a significant difference between the two growth stages at the level of 0.01 based on t-test
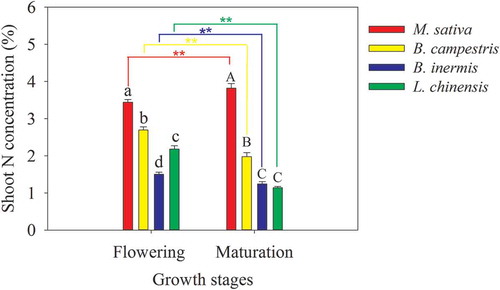
Figure 3. Soil NO3−-N and NH4+-N concentrations in the four species cultivations during the flowering and maturation phases. Different lowercase and uppercase letters mean significant difference in soil NO3−-N or NH4+-N concentration during the flowering and maturation phases, respectively. Two asterisks (**) mean a significant difference between the two growth stages at the level of 0.01 based on t-test
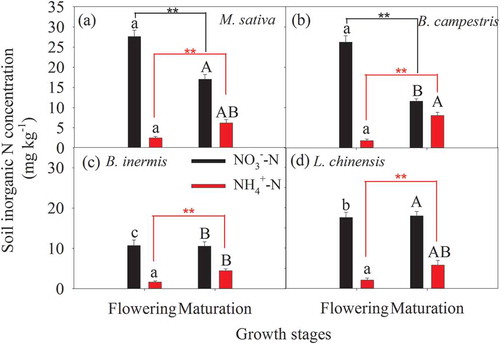
Figure 4. Monthly variation and mean of soil microbial biomass N (MBN) concentration in the different species cultivation plots. Different lowercase letters indicate significant difference among the four species cultivations
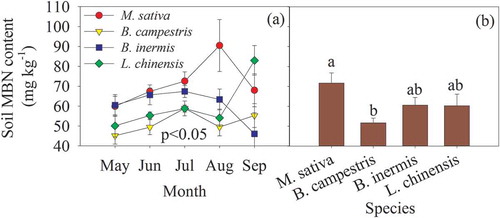
Figure 5. Plant inorganic N uptake rates in the four species cultivations during the flowering and maturation phases. Different lowercase and uppercase letters mean significant difference in plant NO3−-N or NH4+-N uptake rates during the flowering and maturation periods, respectively. Two asterisks (**) mean a significant difference between the two growth stages at the level of 0.01 based on t-test
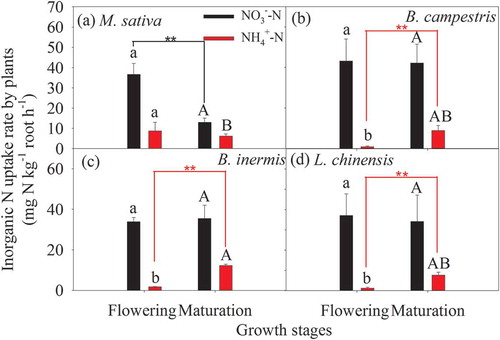
Figure 6. Relationships between plant inorganic N uptake rates and shoot-, root biomass, and root/shoot ratios. B. campestris is removed from the statistical analysis
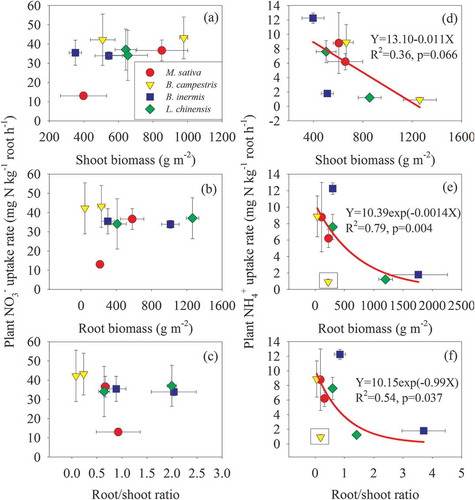
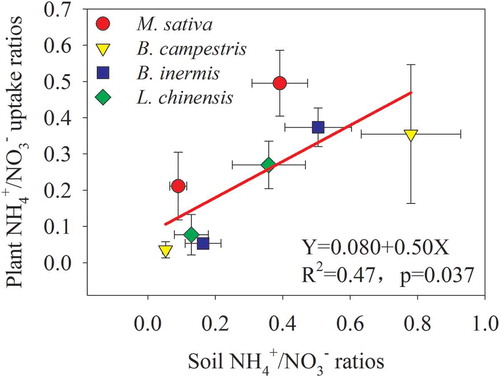
Figure 7. Relationships between plant NH4+/NO3− uptake ratios and soil NH4+/NO3− ratios