
Figures & data
Table 1. Effects of N fertilization on the seed growth of the three soybean genotypes with different nodulation abilities.
Table 2. The σ15N values of mature seeds from plants of three genotypes of soybean.
Figure 1. Effects of the N fertilization on the seed yields of three genotypes of soybean. Symbols indicate the types of N treatment where plants were grown: white, L-L; horizontal stripe, H-L; vertical stripe, L-H; black, H-H. Different letters indicate significant differences between genotypes and N treatments.
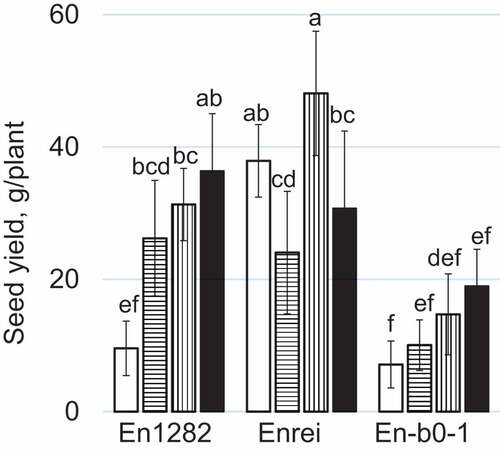
Figure 2. Effects of the N fertilization on the protein content and oil content in seeds from plants of three soybean genotypes. (a): The relationship between the protein content and the seed weight. (b): The relationship between the oil content and the seed weight. (c): The relationship between the oil content and the protein content. Shapes of symbols circles, squares, and triangles indicate the genotypes, En1282, Enrei and En-b0-1, respectively. Patterns inside symbols indicate the types of N treatment described in legend. The correlation coefficients between the protein content and seed weight from the En1282 and Enrei plants were 0.982 and 0.907, respectively. The significance levels were 0.02 and 0.10 for En1282 and Enrei, respectively. The correlation coefficient between the protein content and the oil content from the En-b0-1 plants was −0.924 (p = 0.10).
Figure 3. Interrelationships between the protein content and oil content in seeds from plants of three soybean genotypes.
Figure 4. Effects of the N fertilization on the amounts of protein and oil per seed from plants of the three soybean genotypes. Shapes of symbols indicate the same genotype as those described in legend. Numbers beside marks indicate types of N plots where plants were grown as follows: 1: L-L, 2: H-L, 3: L-H, and 4: H-H. The dotted line indicates the coefficient line between the amount of oil per seed and the amount of protein per seed from En1282 plants (p = 0.01).
Table 3. Contribution of N derived from N2 fixation of plants of two nodulating genotypes grown on fields where had different N treatments (%Ndfa).
Table 4. The ratios and amounts of N originated from the two origins, soil+compound fertilizer, and CUSLNFs, in the total N in seeds from plants of non-nodulating genotype, En1282.
Table 5. The ratios and amounts of N originated from the three origins, soil+compound fertilizer, CUSLNFs, and N2 fixation, in total N in seeds from plants of the two nodulating genotypes, Enrei and En-b0-1.