711
Views
3
CrossRef citations to date
0
Altmetric
Soil chemistry and soil mineralogy

Quantification methods of pyrogenic carbon in soil with soil as a complex matrix: comparing the CTO-375 and Cr2O7 methods

, , , , &
Pages 380-388 | Received 17 Sep 2020, Accepted 01 May 2021, Published online: 09 Jul 2021

Figures & data

Figure 1. PyC/OC ratio of each material (alone) after treatment using the CTO-375, original Cr2O7, and improved Cr2O7 methods. Error bar indicates 1 standard deviation (n = 3). ND: not detected

Figure 1. PyC/OC ratio of each material (alone) after treatment using the CTO-375, original Cr2O7, and improved Cr2O7 methods. Error bar indicates 1 standard deviation (n = 3). ND: not detected

Figure 2. PyC/OC ratio of mixed samples after treatment using the CTO-375, original Cr2O7, and improved Cr2O7 method. For the kaolinite-melanoidin mixture, melanoidin was added to kaolinite at 4% TOC. For the kaolinite-soot mixture and the kaolinite-biochar mixture, pyrogenic carbons were added to kaolinite to set a 10% PyC/OC ratio in the case of the 4% TOC of kaolinite-melanoidin mixture. Values of OC content and PyC content of each material measured by the CTO-375 method were used to make the mixtures, except for the PyC content of biochar. For the content of biochar, the value measured by the Cr2O7 method was used. Error bar indicates 1 standard deviation (n = 3). ND: not detected

Figure 2. PyC/OC ratio of mixed samples after treatment using the CTO-375, original Cr2O7, and improved Cr2O7 method. For the kaolinite-melanoidin mixture, melanoidin was added to kaolinite at 4% TOC. For the kaolinite-soot mixture and the kaolinite-biochar mixture, pyrogenic carbons were added to kaolinite to set a 10% PyC/OC ratio in the case of the 4% TOC of kaolinite-melanoidin mixture. Values of OC content and PyC content of each material measured by the CTO-375 method were used to make the mixtures, except for the PyC content of biochar. For the content of biochar, the value measured by the Cr2O7 method was used. Error bar indicates 1 standard deviation (n = 3). ND: not detected

Figure 3. PyC/OC ratio of mixed samples designed to mimic environmental soil after treatment using the CTO-375, original Cr2O7, and improved Cr2O7 method. The TOC content and PyC/OC ratio of the mixture were set to 4% and 10%, respectively. The values of OC content and PyC content of each material measured by the CTO-375 method were used to make the mixtures, except for the PyC content of biochar. For the content of biochar, the value measured by the Cr2O7 method was used. The error bar indicates 1 standard deviation (n = 3) of each constituent material

Figure 3. PyC/OC ratio of mixed samples designed to mimic environmental soil after treatment using the CTO-375, original Cr2O7, and improved Cr2O7 method. The TOC content and PyC/OC ratio of the mixture were set to 4% and 10%, respectively. The values of OC content and PyC content of each material measured by the CTO-375 method were used to make the mixtures, except for the PyC content of biochar. For the content of biochar, the value measured by the Cr2O7 method was used. The error bar indicates 1 standard deviation (n = 3) of each constituent material

Figure 4. Thermograms of mixture samples after CTO treatment. For the kaolinite-melanoidin mixture, the samples were prepared as 4% TOC. For the kaolinite-soot mixture and kaolinite-melanoidin-soot mixture, the samples were prepared as 4% TOC, and as theoretically 10% PyC/OC ratio at 375°C. OC and PyC contents for each material measured using the CTO-375 method were used to make the mixtures. The arrows shown in the figure indicate whether the legend depends on the value of the left or right axis. Error bar indicates 1 standard deviation (n = 3)

Figure 4. Thermograms of mixture samples after CTO treatment. For the kaolinite-melanoidin mixture, the samples were prepared as 4% TOC. For the kaolinite-soot mixture and kaolinite-melanoidin-soot mixture, the samples were prepared as 4% TOC, and as theoretically 10% PyC/OC ratio at 375°C. OC and PyC contents for each material measured using the CTO-375 method were used to make the mixtures. The arrows shown in the figure indicate whether the legend depends on the value of the left or right axis. Error bar indicates 1 standard deviation (n = 3)

Figure 5. Thermograms of kaolinite-melanoidin mixtures after CTO treatment. Error bar indicates 1 standard deviation (n = 3)

Figure 5. Thermograms of kaolinite-melanoidin mixtures after CTO treatment. Error bar indicates 1 standard deviation (n = 3)

Figure 6. PyC/OC ratios of melanoidin according to different K2Cr2O7 concentrations using the Cr2O7 method. Error bar indicates 1 standard deviation (n = 3). ND: not detected

Figure 6. PyC/OC ratios of melanoidin according to different K2Cr2O7 concentrations using the Cr2O7 method. Error bar indicates 1 standard deviation (n = 3). ND: not detected

Table 1. PyC/OC ratio of volcanic ash soil, and the recovery rate of PyC of the soil mixed with soot or biochar, after treatment using the improved Cr2O7 method

Figure 7. Scanning electron microscope micrographs showing the changes in surface morphology of the soot and biochar after treatment using the improved Cr2O7 method. (A) Soot before treatment. (B) Soot after HF treatment. (C) Soot after HF and K2Cr2O7/H2SO4 treatment (D) Biochar before treatment. (E) Biochar after HF treatment. (F) Biochar after HF and K2Cr2O7/H2SO4 treatment. The enclosed area indicates the regions in which EDS elemental analyses were performed by EDS

Figure 7. Scanning electron microscope micrographs showing the changes in surface morphology of the soot and biochar after treatment using the improved Cr2O7 method. (A) Soot before treatment. (B) Soot after HF treatment. (C) Soot after HF and K2Cr2O7/H2SO4 treatment (D) Biochar before treatment. (E) Biochar after HF treatment. (F) Biochar after HF and K2Cr2O7/H2SO4 treatment. The enclosed area indicates the regions in which EDS elemental analyses were performed by EDS

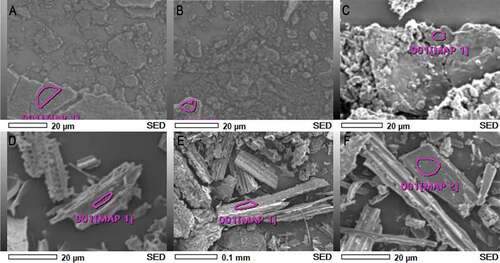
Table 2. EDS analyses showing the hanging O/C ratios in soot and biochar treated by HF and K2Cr2O7/H2SO4.

Reprints and Corporate Permissions

Please note: Selecting permissions does not provide access to the full text of the article, please see our help page How do I view content?

To request a reprint or corporate permissions for this article, please click on the relevant link below:

Academic Permissions

Please note: Selecting permissions does not provide access to the full text of the article, please see our help page How do I view content?

Obtain permissions instantly via Rightslink by clicking on the button below:

If you are unable to obtain permissions via Rightslink, please complete and submit this Permissions form. For more information, please visit our Permissions help page.