Figures & data
Figure 1. Cluster root (CR) developmental stages in white lupin and relative gene expression for LaACC oxidase1 and LaACC synthase1 in 3 developmental stages.
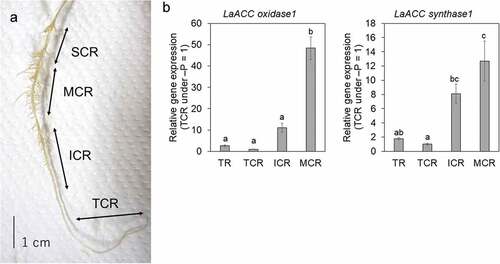
Table 1. Plant biomass and P concentration in shoot and root after Co2+ and 1-aminocyclopropane-1-carboxylic acid (ACC) treatments. Different letters indicate statistically significant differences (p < 0.05; Tukey-Kramer) among treatments (n = 5).
Figure 2. Cluster roots (CRs) influenced by reagent related to ethylene.
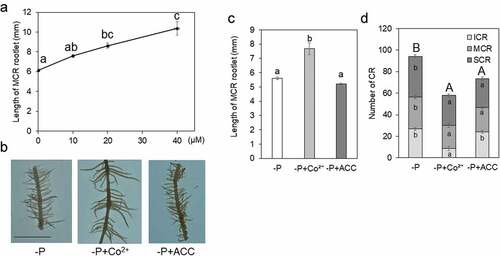
Figure 3. Relative gene expression for a)LaERF, b)LaS8H, c)LaMYB72, d)LabHLH39, e)LaSAP2, f)LaSAP1, g)LaPT1, h)LaCS1, i)LaCS2, and j)LaMATE6 in roots.
Figure 4. Effects of Co2+ and 1-aminocyclopropane-1-carboxylic acid (ACC) on citrate concentration in roots.
Figure 5. Schematic diagram to represent for the role of ethylene in cluster root (CR). ACC, 1-aminocyclopropane-1-carboxylic acid.