Figures & data
Figure 1. Virtual experiments for an objective decision-making tool for conservation and restoration.
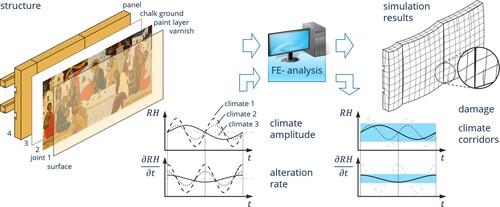
Figure 2. View of the lower part of the iconostasis of the Russian Memorial Church Leipzig; the icon Last Supper is located directly above the Tsar-door.
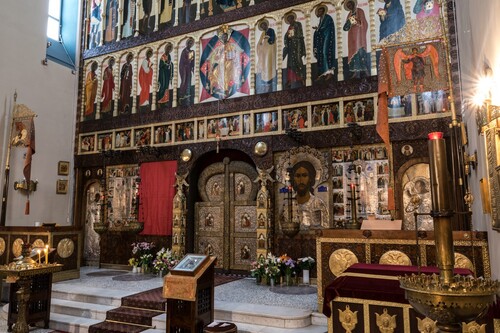
Figure 3. Icon Last Supper (149 × 66.5 cm) by N.S. Emelyanov.
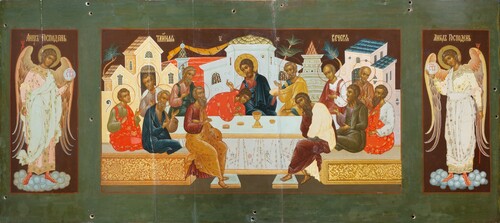
Figure 4. Cross-section of a sample of the panel: individual values of the tree ring widths are: 521, 320, 254, and 162 μm.
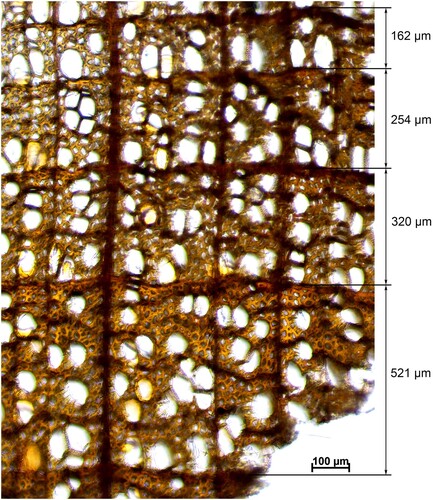
Figure 5. X-Ray image of the upper crossbar (Photograph: Kerstin Hohdorf 2019). The red sketch represents the likely outline of the cross-section when the bar was made.
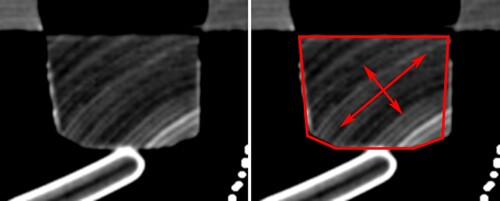
Figure 6. Drawing of the construction of the panel based on CT, with three CT-sections of the panel (top, centre, bottom).
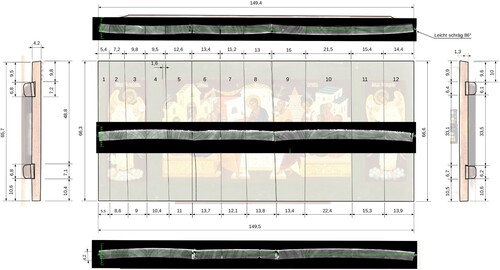
Figure 7. Example of a drawing of a single board of the panel. The wavy shape of the tree rings is visible.
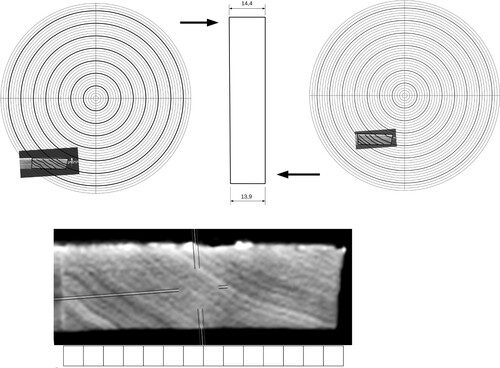
Figure 8. A cross-section of joint No. 4 from the back of the icon in normal light (left) and under UV illumination (middle). The glutin glue reveals itself by a bright bluish fluorescence. There is virtually no layer of glue. The glue penetrated the wood cells. On joint No. 11 (right), a glue layer of more than 0.1 mm is visible.

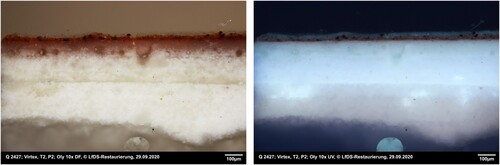
Figure 9. Cross-section of a sample from the green background: (left) visible light, (centre) UV fluorescence, (right) stained with Sypro Ruby® under blue light fluorescence (Leica I3) showing the entire stratigraphy, textile layer with thick sizing layer, ground layer with yellow discolouration, and double green paint layer.
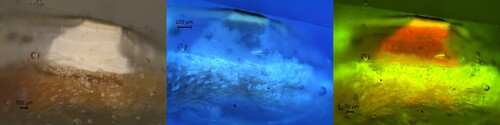
Figure 10. FTIR spectra (transmission mode): (top) yellow discoloured ground layer. Alkyl bands (2922 cm−1 and 2863 cm−1) indicate oil content, other absorptions are caused mainly by calcium carbonate and protein (1645 cm−1); (bottom) linseed oil reference.
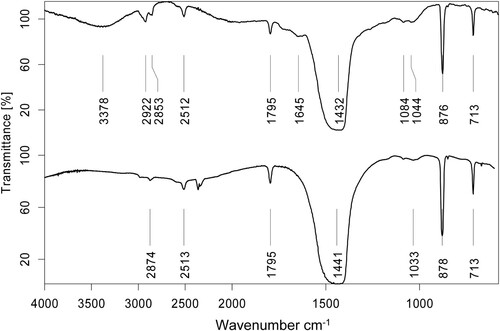
Figure 11. Detail of the right angel under (left) visible light, (centre) infrared, and (right) visible reflective light. In infrared, the lines of the sketch are visible. The scratches (graphja) are seen as dark lines when illuminated in reflected light. The bubbles in the ground layer are recognizable as round dark spots (right).
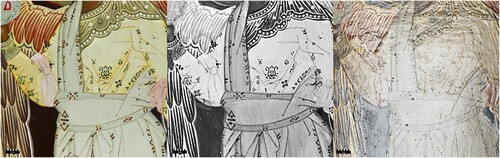
Figure 12. Cross-section of a sample from flesh tone of the neck of the apostle in the left foreground, (left) visible light, and (right) UV fluorescence: on top of the white ground layer, two paint layers and then three very thin paint layers are visible.
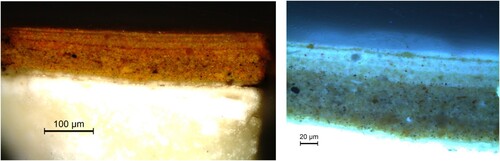
Figure 13. FTIR spectra (transmission mode): (top) grey paint, (middle) green paint after extraction prior to GC-MS analysis, (bottom) egg yolk reference. Absorptions at 2930 cm−1, 2860 cm−1, and 1735 cm−1 indicate oil content. Weaker absorptions at 1650 cm−1 (shoulder) and 1540 cm−1 indicate protein. Other absorptions in the spectrum of the green paint (middle) are caused mainly by pigments: Prussian blue (2091 cm−1), lead white (1411 cm−1, 684 cm−1), and clay minerals (3700 cm−1, 3623 cm−1, 1036 cm−1, 915 cm−1).
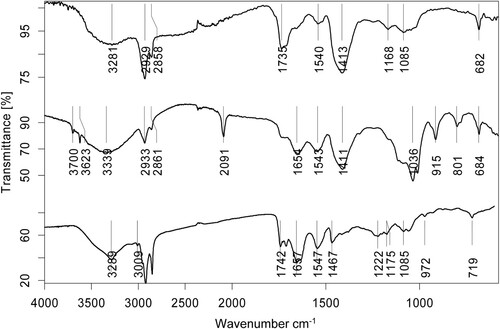
Figure 14. Results of GC-MS analysis of amino acids in a green paint sample, depicted as amino acid profile based on normalized peaks: 1 = L-alanine 2TBDMS derivative, 2 = glycine 2TBDMS derivative, 3 = L-valine 2TBDMS derivative, 4 = L-leucine 2TBDMS derivative, 5 = isoleucine 2TBDMS derivative, 6 = L-proline 2TBDMS derivative, 7 = L-aspartic acid 2TBDMS derivative 8 = L-hydroxyproline 2TBDMS derivative, 9 = L-serine 3TBDMS derivative, 10 = L-phenylalanine 2TBDMS derivative, 11 = L-aspartic acid 3TBDMS derivative, 12 = L-glutamic acid 3TBDMS derivative, 13 = L-lysine 3TBDMS derivative, 14 = L-tyrosine 3TBDMS derivative.
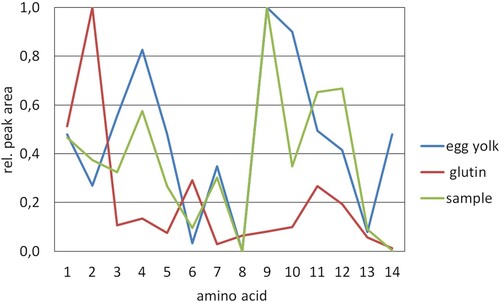
Figure 15. Cross-section of a sample from the metal leaf application on the bench in the left foreground, under visible light: on top of the white ground layer two paint layers, a white preparation layer, and gold foil are visible.
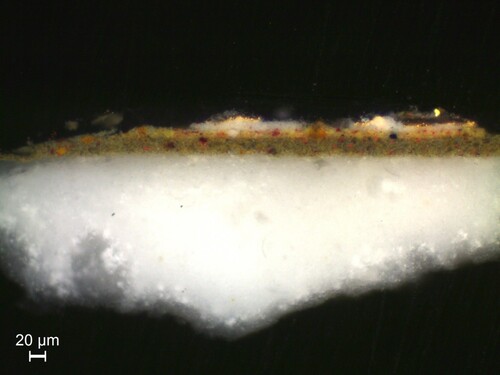
Figure 16. Detail under UV irradiation (contrast enhanced): arrow 1 indicates yellowish fluorescent islets that can be interpreted as remains of the partially removed upper layer of the olifa, arrow 2 indicates a second varnish layer that can be found on the entire surface, and a third varnish layer (arrow 3) that was applied partially. Retouching and overpainting lying above the varnish layers appear darker, as can be seen on the joint (on the right side of the photograph).
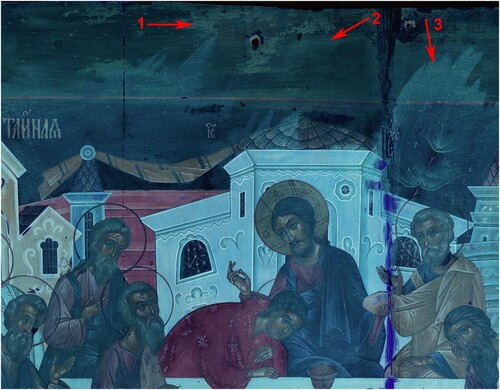
Figure 17. Drawing from Spannagel (Citation1954, 51) showing the correct method to join boards to prevent cupping of a panel.
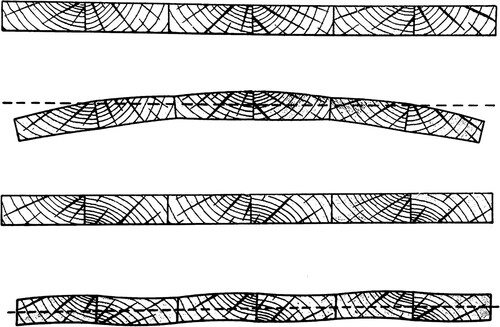
Figure 18. Cross-section of a sample from a replica manufactured according to the traditional technique of icon painting, (left) visible light, (right) UV fluorescence. The impregnation of the white ground layer with the oil coating (olifa) into a depth of about 250–300 μm is visible especially under UV fluorescence. (Photographs by S. Reuther, Landesamt für Denkamlpflege, Dresden).