Figures & data
Figure 1. Fragments of works at the Afghan National Gallery destroyed by the Taliban.
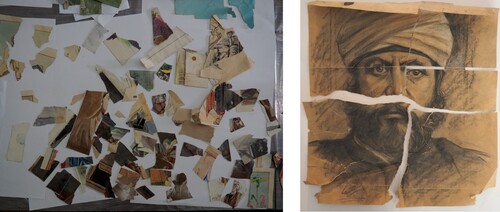
Figure 2. Removal of gouache overpaint from disguised figure, 2019.
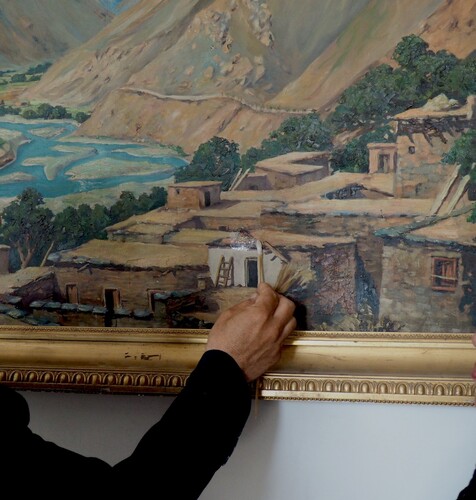
Figure 3. Needs analysis questionnaire results.
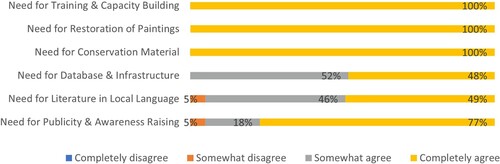
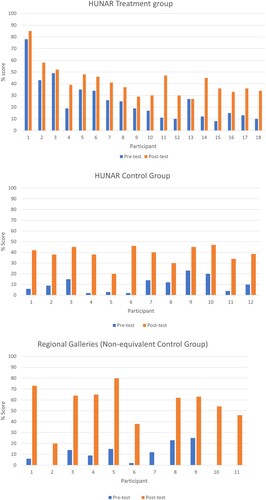
Figure 4. HUNAR: Treatment group and non-equivalent control group pre-test/post-test measurement (Hashimi Citation2021).
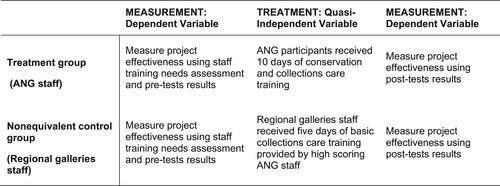
Figure 5. Pre- and post-test training results showing treatment, control, and non-equivalent control groups (Hashimi Citation2021).