Figures & data
Table 1. Particulars of different regions of Ethiopia used for collection of samples (Tesema & Drieling, Citation2019).
Table 2. H2SD, Sticky points: before ginning.
Table 3. H2SD, Sticky points: After Ginning.
Figure 1. Cross-section of Lummus SentinelTM lint cleaner (Left). The process of lint cleaning by beating the tufts against the grid bars (Right).
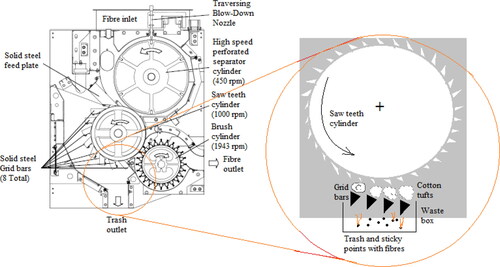
Table 4. ANOVA Analysis – Effect of Ginning on H2SD sticky points.
Table 5. ANOVA Analysis - H2SD stickiness variations between growing areas.
Figure 2. Mean H2SD stickiness points befor and after ginning.
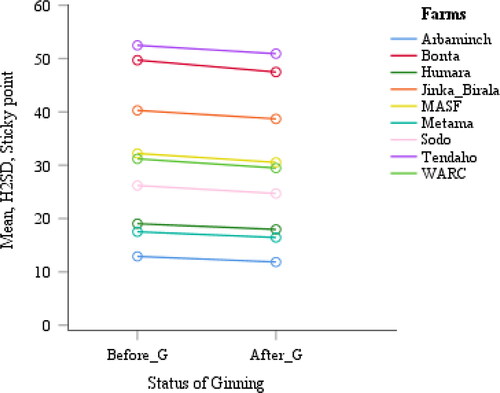
Figure 3. HPLC: (% fibre weight).
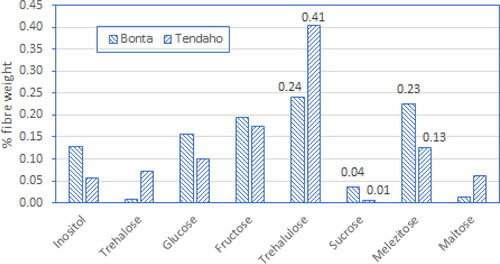
Table 6. Sugar contents, measured by high-performance liquid chromatography for the nine cotton growing areas, expressed as a percentage of the fiber weight.
Figure 4. HPLC: (% total sugars).
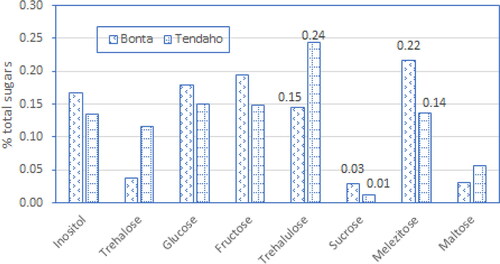
Table 7. Sugar contents, measured by high-performance liquid chromatography for the nine cotton growing areas, expressed as a percentage of the total sugars.
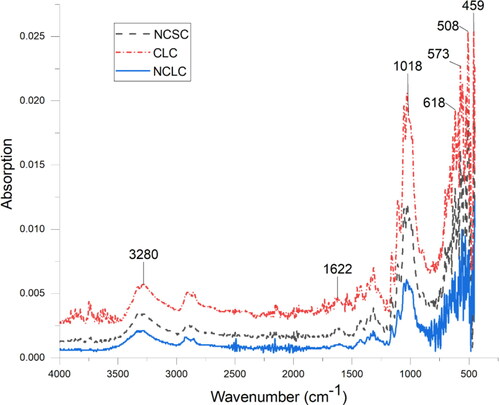
Figure 5. FTIR spectra: Non-contaminated lint cotton (after ginning) (NCLC), non-contaminated seed cotton (before ginning) (NCSC) and contaminated lint cotton (after ginning) (CLC).