Figures & data
Figure 1. The original polycotton fabric and two recovered products from the separation of the 80/20 polyester/cotton blend. Note the heightened transparency of the recovered polyester due to cotton removal.
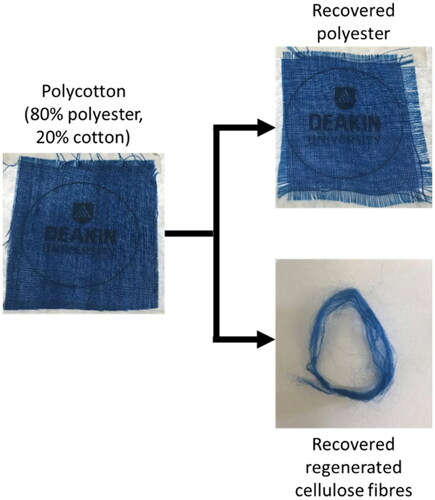
Table 1. Descriptions for different values for the colour difference.
Figure 2. (a) Thermal gravimetric analysis (TGA) data displaying the thermal decomposition of 100% polyester fabric, recovered polyester, and the 80/20 polycotton blend, (b) thermal decomposition of treated and untreated 100% polyester, and (c) Differential Scanning Calorimetry (DSC) data showing the melt characteristics of 100% polyester and recovered polyester from the 80/20 blend.
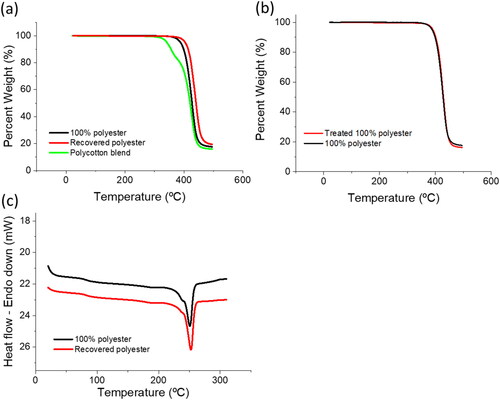
Table 2. DSC results including the onset and midpoint of the glass transition, the onset and peak for melting temperature, and the enthalpy for 100% polyester and recovered polyester from the 80/20 polycotton blend.
Figure 3. FTIR spectra for (a) 100% polyester and recovered polyester from 80/20 polycotton and (b) 100% polyester, 100% cotton, and 80/20 polycotton fabric.
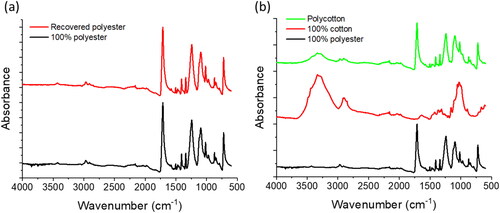
Table 3. Draw ratio, linear density, tenacity, elongation, and elastic modulus of fibres produced form 100% cotton and from polycotton, compared to viscose fibres.
Table 4. CEILab space coordinates, colour strength values and colour difference values for polycotton 80:20 blend, 100% polyester and recovered materials.
Figure 4. Schematic showing that the discrete dye colour specific to fibre type is retained on the recovered materials. Note the dark colour of the sample labelled ‘mixed and pre-treated’ and the solution-dispersion labelled ‘dissolved’ indicating a homogenous mixture of dissolved orange cotton and undissolved blue polyester snippets.
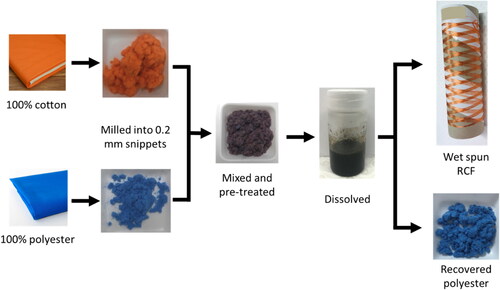
Figure 5. SEM images for chopped snippets of (a) 100% polyester and (b) recovered polyester, (c) polycotton 80/20 fabric and (d) recovered polyester fabric, and (e) polycotton 80/20 fibre bundle and (f) recovered polyester bundle.
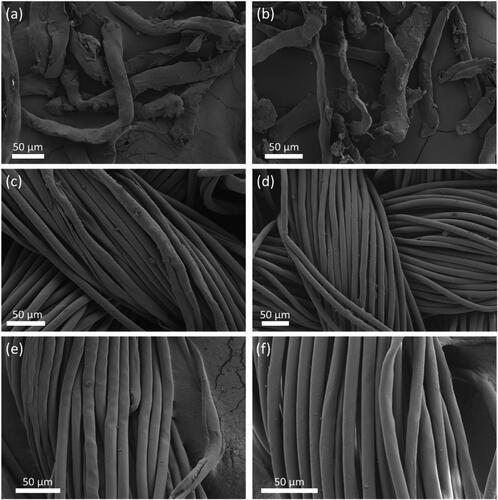
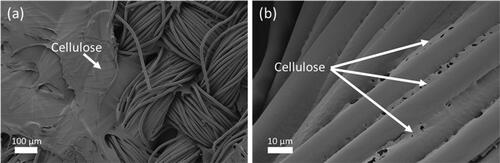
Figure 6. SEM images of recovered polyester fabric at low (a) and high (b) magnification displaying the residual cellulose film remaining on the polyester fibres before the DMSO rinse step was introduced. The regenerated cellulose film is labelled as ‘Cellulose’.