
Figures & data
Figure 1. A demonstration of how the surprise test is influenced by the temporal spacing and range of the archaeological sites forming the sample population against which the exceptionality of an alternative site is assessed. Figures 1(a,b) demonstrate the same small temporal gap, but due to the more constricted spacing and range of the early sites in 1B, this is the only record to produce a significant P-value. This is because the investigated gap is relatively greater in this scenario. The same is illustrated in Figures 1(c,d) under slightly different temporal circumstances and in the reverse temporal direction.
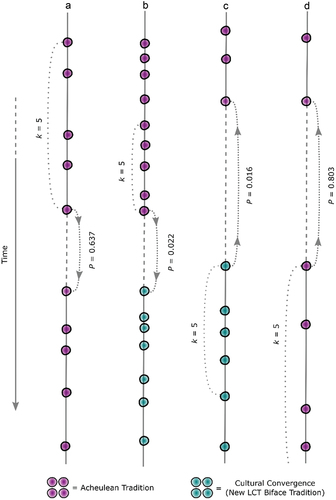
Figure 2. A demonstration of how the temporal spacing and range of a sample population (site sample) influences the surprise test’s results, and in turn, the designation of cultural convergence. In Scenario 2A, two ‘outlier’ sites are investigated relative to an earlier sample, but only ‘Outlier 2’ is sufficiently separate from the sample population for it to support the inference that the original cultural tradition ended (as depicted by the modelled Gumbel distribution). Note that ‘Outlier 1’ would not exist in the tested scenario for ‘Outlier 2’. Scenarios 2B and 2C depict the same but in the reverse temporal direction.
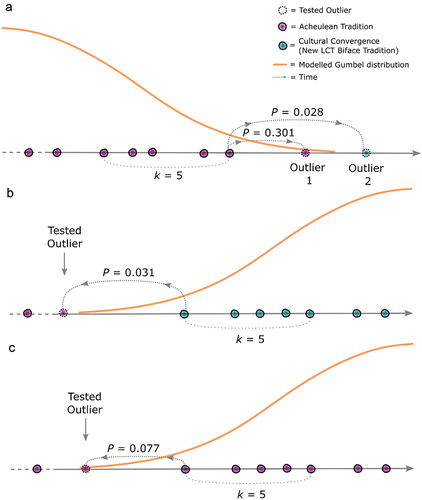
Table 1. Archaeological sites and dates used in the early Acheulean analyses. The Acheulean occurrences are represented here by the ten earliest sites currently known. In addition, the 1.98 Ma age modelled by Key, Roberts, and Jarić (Citation2021c) is also included; this represents the date beyond which the probability of the Acheulean occurring (based on current evidence) is <5%. In addition to the explanation outlined by Key, Roberts, and Jarić (Citation2021c), these data do not include the recently dated ~1.6 Ma Acheulean artefacts from Melka Kunture (Gombore IB) (Mussi et al. Citation2021), which were excluded as they are ~100 m from the similarly aged Garba IV (Gallotti and Mussi Citation2018) occurrence that is included. A 1.67 Ma age has also been suggested for Acheulean artefacts at Oued Boucherit (Algeria) (Duval et al. Citation2021), however, this occurrence was excluded as its age relies on average sediment accumulation rates. Newly published dates from the T69 complex at Olduvai Gorge are not included due to their close proximity and temporal overlap with EF-HR (Fujioka et al. Citation2022).
Figure 3. Competing cultural scenarios that explain the temporal record of bifacial LCT dominated Pleistocene sites. Figure 3(a) presents a series of bifacial LCT archaeological sites through time in two regions. Within Region 2, there is a gap in the archaeological record, potentially hinting at a loss of cultural information. This gap becomes the focus of investigation. Figure 3(b) depicts a single Acheulean tradition, with the occasional flow of cultural information between regions. Investigation of the temporal gap using the surprise test returned a P-value greater than α, suggesting there to be no break in the presence of Acheulean cultural information in Region 2. If the test returned a significant result, and cessation of the Acheulean was inferred in Region 2, it is possible that homologous bifacial LCT cultural information (i.e. the Acheulean) was transmitted back into the area via the flow of cultural information from Region 1 (Figure 3(c)). Figures 3(d,e) demonstrate scenarios where the test suggests the Acheulean to end in Region 2 but barriers to the reintroduction of homologous cultural information from Region 1 exist, meaning the later bifacial LCT sites in Region 2 could be the result of cultural convergence.
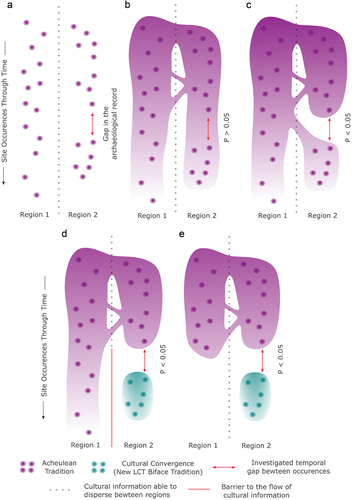
Figure 4. The archaeological sites used in the present study imposed onto the distribution of the Acheulean as we currently understand it. Solid dots represent sites used in the early Acheulean models, while dots with a hollow centre represent sites used in the late Acheulean models. Those that are half full represent sites contributing to both scenario types.
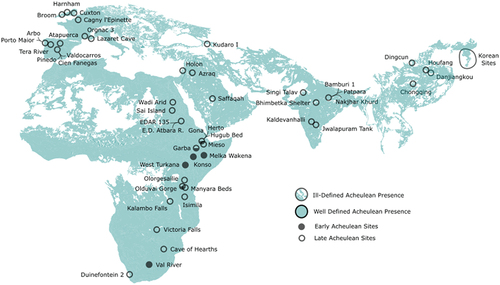
Table 2. Significance values for all early Acheulean modelled scenarios using Solow and Smith’s (Citation2005) surprise test for the exceptionality of a record relative to other dated occurrences. Note the reverse (↑) or forward (↓) temporal direction of the models, as when combined with the displayed k value it indicates the site sample used to test the exceptionality of the individual site’s P-value.
Table 3. Significance values for all central estimate modelled scenarios in the late Acheulean analyses. Note the reverse (↑) or forward (↓) temporal direction of the models, as when combined with the displayed k value it indicates the site sample used to test the exceptionality of the individual site’s P-value. See supplementary table S2 for the matching resampling data.
Table 4. Significance values for all modelled scenarios in the Korean late Acheulean scenario. All sites are from the Korean Peninsula, unless otherwise indicated. Note the reverse (↑) or forward (↓) temporal direction of the models, as when combined with the displayed k value it indicates the site sample used to test the exceptionality of the individual site’s P-value.
Supplemental Material
Download MS Word (48.3 KB)Data availability statement
All data are available in the text or supplementary information. The relevant code is available in Roberts et al. (Citationin press).