
Figures & data
Table 1. Burial site logistics and surface-level changes that are taken into consideration when searching for covert burials.
Figure 1. Mala X330 GPR in use. The transmitting and receiving antennae are inside the grey Mala box, with the GPR wheel at the back, and an extendable pole at the front. The monitor is used to set the survey parameters and can also display real-time data as the survey is progressing. This is useful to check that the wheel is tracking distance correctly.
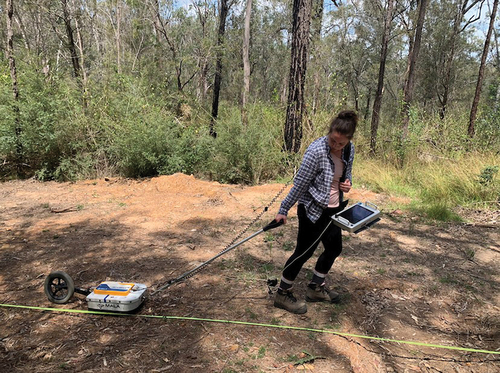
Figure 2. Fully set up ERT line, using a ZZ FlashRes64. The ERT line above is 16 m with a 0.25 m electrode spacing. The two orange 32 multi-core cables, which pass the electrical current, are attached to each of the electrodes and then attached to the ERT machine in the middle of the line. Power is obtained from a car battery with the ZZ software being run off a tablet.
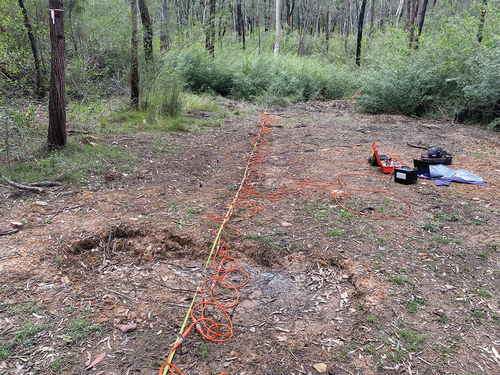
Figure 3. Basic multi-line GPR survey set up with perpendicularly oriented grave. The yellow oval depicts the clandestine grave, with the black lines depicting the GPR survey lines. This way, multiple GPR lines can detect the grave-related anomalies, increasing the chances of locating the grave, as well as providing more precise grave dimensions.
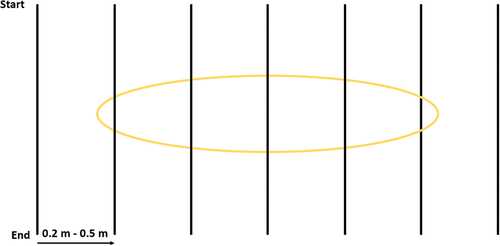
Figure 4. Basic multi-line GPR set up with vertically oriented grave. The yellow oval depicts the grave, with the black lines depicting the GPR lines. This way, there are fewer GPR lines that can detect the grave-related anomalies, potentially affecting the ability to locate the grave and provide more precise grave dimensions. In this scenario, only two GPR lines are covering the grave, meaning only two GPR lines may show a grave-related anomaly. This can be problematic because finding the precise location of grave may be more difficult.
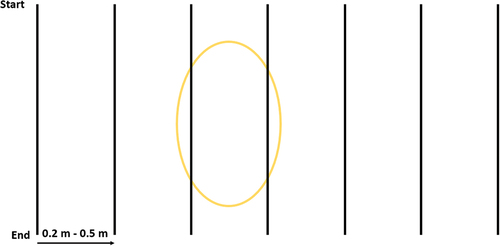
Table 2. Best practice GPR settings for forensic investigations.
Table 3. Best practice ERT settings for forensic investigations.
Figure 5. GPR (a) and ERT (Dipole-Dipole [b] and Wenner [c] arrays) profiles of three pig burials that were surveyed 14-months postburial at a research site in Western Sydney. The green boxes denote the three graves; the left-most box is a single grave with one pig that measures 1 m × 2 m × 0.5 m, the middle box is a mass grave with three pigs that measures 3 m × 2 m × 1 m, and the right-most box is a single grave with one pig that measures 0.75 m × 2 m × 1.8 m. The yellow ovals denote areas that could also be interpreted as graves based on their size and depth. The GPR data were processed in ReflexW (1- moving the start time via a static correction, 2 – subtracting mean from traces via a ‘de-wow’, 3 – applying an energy decay gain, 4 – applying a bandpass Butterworth filter, and 5 – applying a 2D running average filter. The ERT data were transformed in R and processed (exterminating bad data points) and inverted (using a least squares L2 robust inversion) in Res2DInv. The Root Mean Square (RMS) values for the Dipole-Dipole and Wenner arrays are 15.5% and 7.9%, respectively.
![Figure 5. GPR (a) and ERT (Dipole-Dipole [b] and Wenner [c] arrays) profiles of three pig burials that were surveyed 14-months postburial at a research site in Western Sydney. The green boxes denote the three graves; the left-most box is a single grave with one pig that measures 1 m × 2 m × 0.5 m, the middle box is a mass grave with three pigs that measures 3 m × 2 m × 1 m, and the right-most box is a single grave with one pig that measures 0.75 m × 2 m × 1.8 m. The yellow ovals denote areas that could also be interpreted as graves based on their size and depth. The GPR data were processed in ReflexW (1- moving the start time via a static correction, 2 – subtracting mean from traces via a ‘de-wow’, 3 – applying an energy decay gain, 4 – applying a bandpass Butterworth filter, and 5 – applying a 2D running average filter. The ERT data were transformed in R and processed (exterminating bad data points) and inverted (using a least squares L2 robust inversion) in Res2DInv. The Root Mean Square (RMS) values for the Dipole-Dipole and Wenner arrays are 15.5% and 7.9%, respectively.](/cms/asset/27ef7ac6-3053-4b7b-a40b-081a99561ca6/tajf_a_2252531_f0005_oc.jpg)