Figures & data
Figure 1. The structure of GNA.
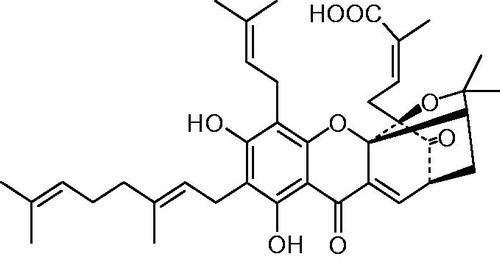
Figure 2. Transmission electron microscopy micrographs of NLCs: (A and B) GNA-NLC and (C and D) GNA-PEG–NLC.
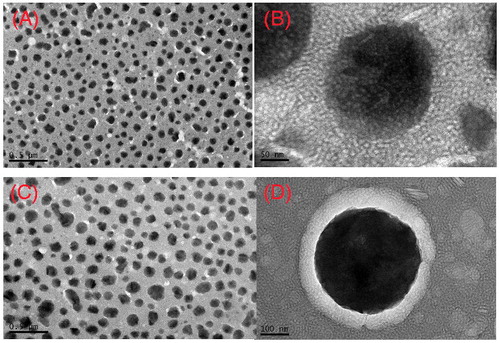
Figure 3. (A–C) DSC curves of each the components of the formulations and GNA, and NLC formulations.
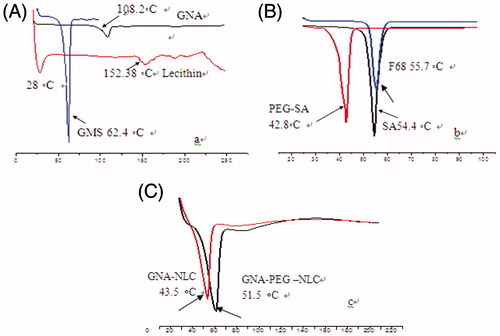
Figure 4. Release profiles of GNA from GNA-PEG-NLC and GNA-NLC in PBS pH 7.4 at 37 °C (n = 3).
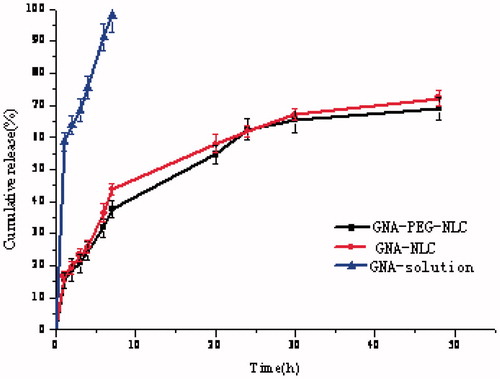
Figure 5. Representative photomicrographs of vein damage caused by injection GNA-PEG–NLC (A), Blank PEG NLC (B), GNA-NLC (C), Blank NLC (D), GNA-solution (E), and PEG200 + 0.9% NaCl solution (F) (×100).
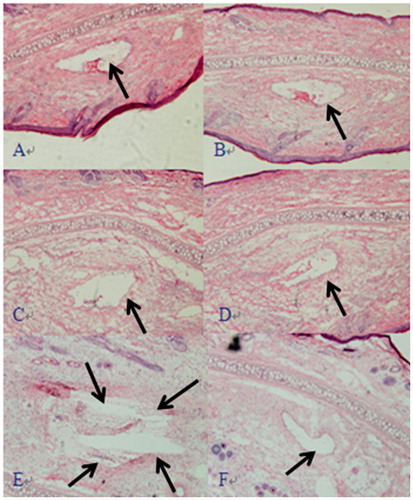
Figure 6. Mean concentration time profile of GNA in plasma following i.v. administration of a single dose of 1.0 mg/kg GNA-PEG-NLC, GNA-NLC, and GNA-solution to rats (n = 6).
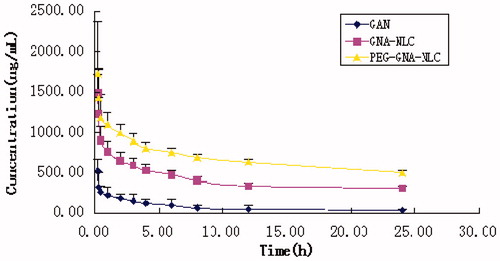
Table 1. The main pharmacokinetic parameters of GNA of plasma following i.v. to rats (n = 6).
Figure 7. The AUC0–t of GNA-solution, GNA-NLC, and GNA-PEG-NLC in tissue following i.v. to rats.
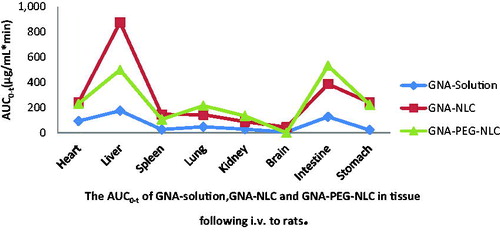
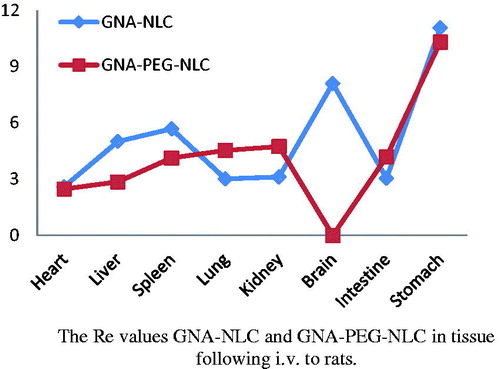
Figure 8. The Re values of GNA-NLC and GNA-PEG-NLC in tissue following i.v. to rats.