Publication Cover
Xenobiotica
the fate of foreign compounds in biological systems
Volume 51, 2021 - Issue 4
2,275
Views
3
CrossRef citations to date
0
Altmetric
Pharmacogenetics

Human total clearance values and volumes of distribution of typical human cytochrome P450 2C9/19 substrates predicted by single-species allometric scaling using pharmacokinetic data sets from common marmosets genotyped for P450 2C19

ORCID Icon, ORCID Icon, ORCID Icon, , , , , & ORCID Icon show all
Pages 479-493 | Received 06 Oct 2020, Accepted 29 Dec 2020, Published online: 17 Jan 2021

Figures & data

Figure 1. Relationship between hepatic blood flow rates and body weights in humans, marmosets, and other experimental animal species.

Figure 1. Relationship between hepatic blood flow rates and body weights in humans, marmosets, and other experimental animal species.

Table 1. Physicochemical properties, cassette-dose cocktail group numbers, LC–MS/MS conditions, and reported enzymes responsible for metabolism in humans of the 24 model compounds tested in this study.

Table 2. Phenotypes and genotypes of polymorphic CYP2C19 for the six marmosets used in this study and their frequencies in a breeder cohort.

Figure 2. Plasma concentrations of unchanged drug following intravenous administrations of 24 model drugs to extensive (open circles) and poor (solid triangles) metaboliser marmosets. Dosing levels were 0.20 mg/kg for ibuprofen, midazolam, and telmisartan, and 0.10 mg/kg for the other compounds. Asterisks denote compounds whose total clearances were significantly reduced in the poor metaboliser group compared with the extensive metaboliser group at significance levels of *p< 0.05 and **p< 0.01, respectively (unpaired t test). Data points are the means of three marmosets per group and the whiskers show SDs.

Figure 2. Plasma concentrations of unchanged drug following intravenous administrations of 24 model drugs to extensive (open circles) and poor (solid triangles) metaboliser marmosets. Dosing levels were 0.20 mg/kg for ibuprofen, midazolam, and telmisartan, and 0.10 mg/kg for the other compounds. Asterisks denote compounds whose total clearances were significantly reduced in the poor metaboliser group compared with the extensive metaboliser group at significance levels of *p< 0.05 and **p< 0.01, respectively (unpaired t test). Data points are the means of three marmosets per group and the whiskers show SDs.

Table 3. Total clearance (CLt) values and distribution volumes at steady state (Vss) observed in marmosets and predicted for humans by single-species allometric scaling based on pharmacokinetic data sets in marmosets.

Figure 3. Relationships between observed human CLt values and those obtained by single-species allometric scaling using data from extensive metaboliser (EM) (A), poor metaboliser (PM) (B), and mixed (C) marmoset groups with corresponding mean scaling factors. (a) Cilomilast; (b) S-warfarin; (c) repaglinide; (d) tolbutamide; (e) phenytoin; (f) ketanserin; and (g) acetaminophen. The same sets of data were scaled using the generally adopted fixed exponent of 0.75 and were plotted against observed human CLt values (D–F). Open, grey, and solid symbols represent compounds with expected significant, minor, and no contributions of CYP2C19 to their metabolism, respectively. The solid and dashed lines represent unity and twofold differences, respectively.

Figure 3. Relationships between observed human CLt values and those obtained by single-species allometric scaling using data from extensive metaboliser (EM) (A), poor metaboliser (PM) (B), and mixed (C) marmoset groups with corresponding mean scaling factors. (a) Cilomilast; (b) S-warfarin; (c) repaglinide; (d) tolbutamide; (e) phenytoin; (f) ketanserin; and (g) acetaminophen. The same sets of data were scaled using the generally adopted fixed exponent of 0.75 and were plotted against observed human CLt values (D–F). Open, grey, and solid symbols represent compounds with expected significant, minor, and no contributions of CYP2C19 to their metabolism, respectively. The solid and dashed lines represent unity and twofold differences, respectively.

Figure 4. Relationships between observed human Vss values and those obtained by single-species allometric scaling using data from EM (A), PM (B), and mixed (C) marmoset groups with corresponding mean scaling factors. (h) Ketoprofen; (i) itraconazole. The same sets of data were scaled using a fixed exponent of 1.0 and were plotted against observed human Vss values (D–F). The solid and dotted lines represent unity and twofold differences, respectively.

Figure 4. Relationships between observed human Vss values and those obtained by single-species allometric scaling using data from EM (A), PM (B), and mixed (C) marmoset groups with corresponding mean scaling factors. (h) Ketoprofen; (i) itraconazole. The same sets of data were scaled using a fixed exponent of 1.0 and were plotted against observed human Vss values (D–F). The solid and dotted lines represent unity and twofold differences, respectively.

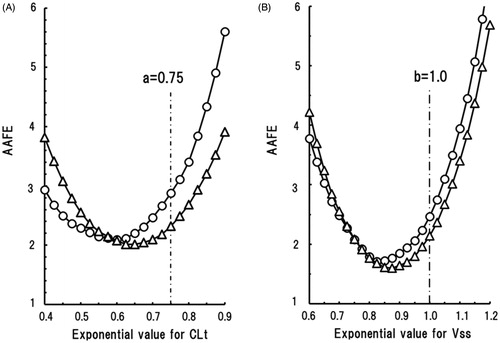
Table 4. Average absolute fold errors (AAFEs) and the percentages of CLt and Vss values within two- and threefold errors compared with the observed values in humans for values predicted by single-species allometric scaling in extensive (EM) and poor (PM) metaboliser marmosets.

Figure 5. Shown are the effects of changes to the scaling exponent for human CLt (A) and Vss (B) predictions on the average absolute fold error (AAFE) using data from EM (circles) and PM (triangles) marmoset groups.

Figure 5. Shown are the effects of changes to the scaling exponent for human CLt (A) and Vss (B) predictions on the average absolute fold error (AAFE) using data from EM (circles) and PM (triangles) marmoset groups.

Figure 6. Relationships between observed human CLt (A–C) and Vss (D–F) values and those extrapolated by single-species allometric scaling using data from cynomolgus or rhesus monkeys (A, D), the EM marmoset group (B, E), and the PM marmoset group (C, F). Shown are data points for the 15 of the 24 test compounds for which suitable macaque data were available. Mean scaling factors averaged over the 15 substances were used (). (1) Clonazepam; (2) dapsone; (3) telmisartan; (4) acetaminophen; (5) S-warfarin; (6) zaleplon; and (7) ketoprofen. The solid and dotted lines represent unity and twofold differences, respectively.

Figure 6. Relationships between observed human CLt (A–C) and Vss (D–F) values and those extrapolated by single-species allometric scaling using data from cynomolgus or rhesus monkeys (A, D), the EM marmoset group (B, E), and the PM marmoset group (C, F). Shown are data points for the 15 of the 24 test compounds for which suitable macaque data were available. Mean scaling factors averaged over the 15 substances were used (Table 6). (1) Clonazepam; (2) dapsone; (3) telmisartan; (4) acetaminophen; (5) S-warfarin; (6) zaleplon; and (7) ketoprofen. The solid and dotted lines represent unity and twofold differences, respectively.

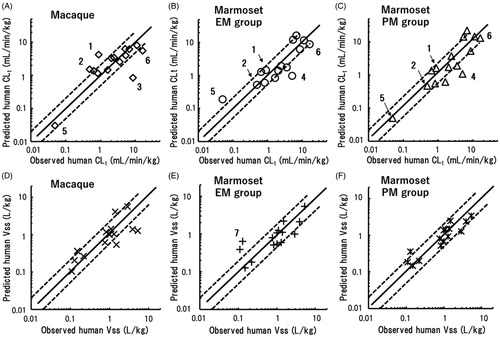
Table 5. Comparison of human total clearance (CLt) values and volumes of distribution (Vss) predicted using single-species allometric scaling from reported data in macaques and observed data in marmosets for 15 of the 24 test compounds.

Table 6. Comparison of predictabilities of human CLt and Vss values for 15 compounds using single-species allometric scaling based on data from macaques and marmosets.