
Figures & data
Figure 1. Structures of decitabine and tetrahydrouridine. Tetrahydrouridine is an inhibitor of CDA, an enzyme found primarily in the gastrointestinal tract and liver, that metabolises decitabine. CDA: cytidine deaminase.
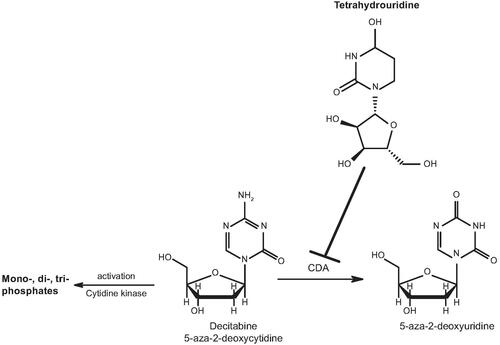
Table 1. Cytochrome P450 activity assays.
Figure 2. Direct inhibition of CYP enzymes by tetrahydrouridine. Shown are mean activity remaining (%) values at eight concentrations of tetrahydrouridine (0.1, 0.268, 0.720, 1.93, 5.18, 13.9, 37.3, and 100 μM). Error bars show ± SD. CYP: cytochrome P450; SD: standard deviation.
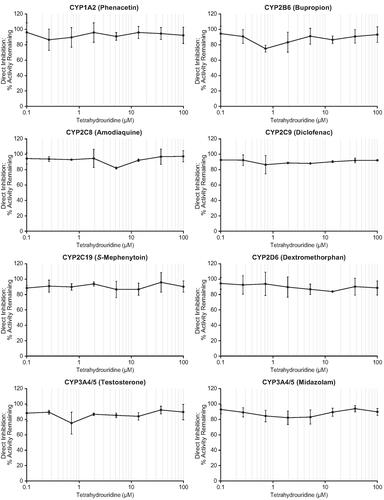
Figure 3. Metabolism-dependent inhibition of CYP enzymes by tetrahydrouridine. Shown are mean activity remaining (%) values at eight concentrations of tetrahydrouridine (0.1, 0.268, 0.720, 1.93, 5.18, 13.9, 37.3, and 100 μM). Error bars show ± SD. CYP: cytochrome P450; SD: standard deviation.
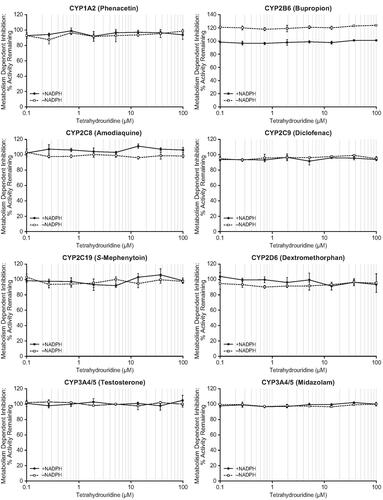
Table 2. Induction of CYP mRNA and enzyme activities by tetrahydrouridine.
Table 3. Involvement of key drug metabolising enzymes in the metabolism of tetrahydrouridine.
Table 4. Uptake of probe substrates (HEK293 cells).
Table 5. Permeability and efflux ratios of probe substrates (Caco-2 cells).
Table 6. ATP-dependent uptake of probe substrates (BSEP membrane vesicles).
Supplemental Material
Download PDF (376.9 KB)Data availability statement
Data sets for the research presented in the publication are available from the corresponding author upon reasonable request.