
Figures & data
Table 1. The metabolic reaction for each CYP isoform.
Representativeinhibitor
Table 2. Effect of goreisan extract on apparent permeability (Papp) and efflux ratio of bi-directional [3H]-digoxin (0.030 μmol/L) transport across polarised Caco-2 cell monolayers.
Figure 1. Inhibitory effect of goreisan extract on the efflux ratio across the Caco-2 cell monolayer for the P-gp substrate, [3H]-digoxin. The open circle represents the observations, a regression curve is shown, and a nonlinear regression model was used to determine the IC50 values.
![Figure 1. Inhibitory effect of goreisan extract on the efflux ratio across the Caco-2 cell monolayer for the P-gp substrate, [3H]-digoxin. The open circle represents the observations, a regression curve is shown, and a nonlinear regression model was used to determine the IC50 values.](/cms/asset/c5f38caa-a312-414b-9ce9-7545f9d59dfb/ixen_a_2078750_f0001_b.jpg)
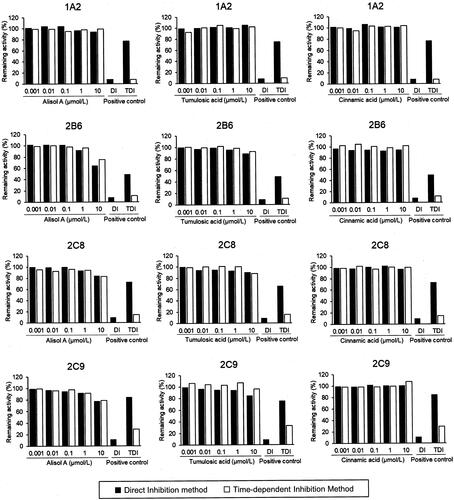
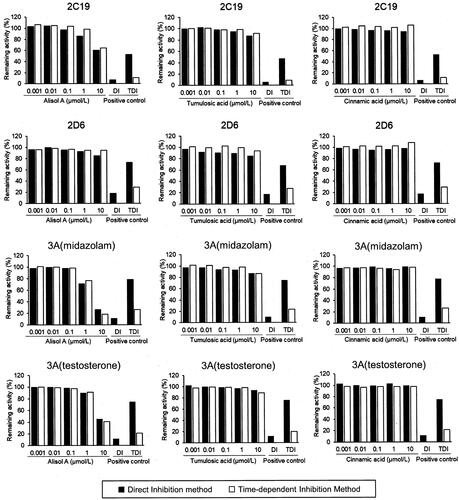
Table 3. IC50 values of alisol A for CYP3A activity in human liver microsomes.
Supplemental material