
Figures & data
Figure 1. Expansion and differentiation medium on canine colonoids. (A) A schematic representation of the canine colonoids cultured in expansion medium (EM) and differentiation medium (DM). The protocol involved initially incubating the organoids in EM for 4 days until they reached maturity. Then, the colonoids were cultured for 4 days in EM or DM. This schematic was created with BioRender.com. (B) Representative phase-contrast microscopy images displaying canine colonoids at Day 8 following EM (Exp) or DM (Diff) culture. Scale bar = 100 µm. (C) Differentiation marker genes including LGR5 (a stem cell marker), MUC2 (a goblet cell marker), Chromogranin A (an enteroendocrine cell marker), and Lysozyme (a Paneth cell marker) were compared between canine colonoids cultured in EM (Exp) or DM (Diff). The error bars represent the standard error of the mean (SEM). (D) Confocal microscopy images demonstrating presence of enteroendocrine cells (Chromogranin A, yellow), goblet cells (SNA, green), apical brush border (F-actin, cyan) and basal nuclei (DAPI, blue) in colonoids grown in DM. Scale bar = 100 µm.
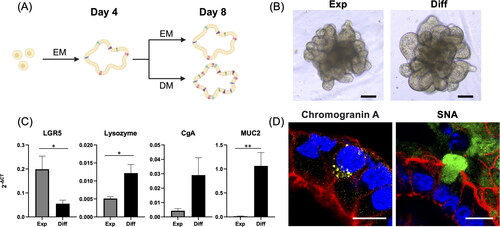
Figure 2. Major P450 gene expression level in canine colonoids. Gene expression levels of CYP2B11, CYP3A98, CYP2C21, and CYP3A12 were assessed using quantitative reverse transcription polymerase chain reaction (qPCR). This analysis compared canine colonoids cultured solely in EM for 8 days (Exp) with those initially cultured in EM for 4 days and then in DM for another 4 days (Diff). The error bars represent the standard error of the mean (SEM).
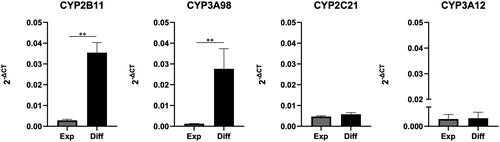
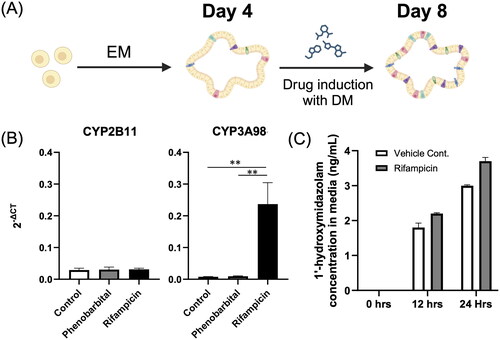
Figure 3. P450 induction and activity assay in canine colonoids. (A) A schematic representation of the drug induction of the canine colonoids. The protocol involved initially incubating the organoids in expansion medium for 4 days until they reached maturity. Then, the colonoids were cultured for 4 days in DM or DM containing 250µM of phenobarbital or 50µM of rifampicin. This schematic was created with BioRender.com. (B) Gene expression levels of CYP2B11 and CYP3A98 were assessed using qPCR following phenobarbital and rifampicin induction assays. The error bars represent the standard error of the mean (SEM). (C) Canine colonoids were cultured for four days in EM before being exposed to DM enriched with 50 μM rifampicin for three days to induce CYP3A enzyme activity. To quantify this activity, the medium was sampled at three time points (0, 12, and 24 hours) following the administration of midazolam. These samples were analysed to measure the concentration of a principal metabolite, 1’-hydroxymidazolam, using HPLC-MS/MS. The error bars represent the standard deviation (SD).
Supplemental Material
Download Zip (759.4 KB)Data availability statement
All relevant data are within the paper and its Supporting Information files.