Figures & data
Table 1. Results of the structural equation model controlling for autoregressive relationships.
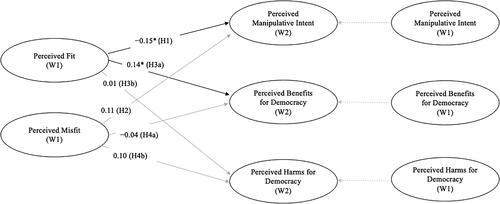
Figure 1. Model showing the relationships between the perceived fit and misfit of targeted political advertising (TPA) on perceived manipulative intent and perceived benefits and harms for democracy. N = 428. The paths were estimated applying robust maximum likelihood estimation. Robust fit indices are reported: χ2 (617) = 857.83, p < .001, CFI = .97, TLI = .96, RMSEA = .03, SRMR = .05. Political interest, political distrust, political ideology, age, gender, education, online behavioral advertising (OBA) knowledge, and privacy concerns served as control variables. Dotted lines show autoregressive relationships. W1 = Wave 1; W2 = Wave 2. *p < .05; **p < .01; ***p < .001.