Figures & data
Table 1. Mean difficulty ratings and syringeable volume for syringeability tests on a scale of 1 (very easy to draw into a syringe) to 10 (impossible to draw into a syringe).
Figure 1. Representative samples of (a) intact, (b) cut, and (c) crushed morphine ARER tablets after a 10-min incubation in 5 mL room temperature water with agitation.
Notes: Panels on the left show the resulting mixture; panels on the right illustrate the attempts to draw the resulting solution into a syringe.
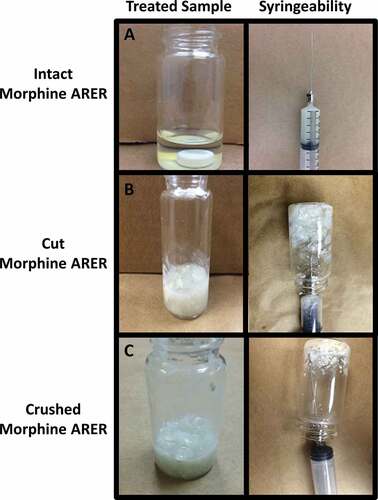
Figure 2. Mean percentage of morphine released from crushed ER morphine after 1, 5, 10, and 30 min of 100 rpm agitation in 10 mL roomtemperature water.
Notes: Error bars = standard deviation; ER = extended-release; SD = standard deviation.
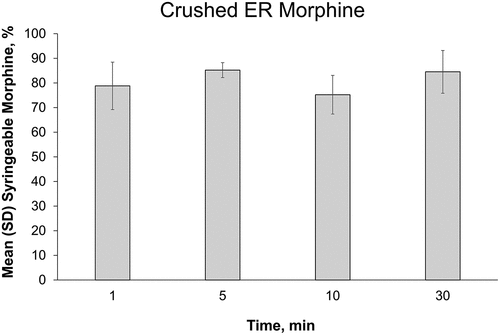
Figure 3. Mean percentage of morphine released after 1, 5, 10, and 30 min in 1 mL, 5 mL, or 10 mL room temperature water with 100 rpm agitation for (a) intact, (b) cut, or (c) crushed morphine ARER tablets. Notes: Error bars = standard deviation; ER = extended-release; SD = standard deviation.
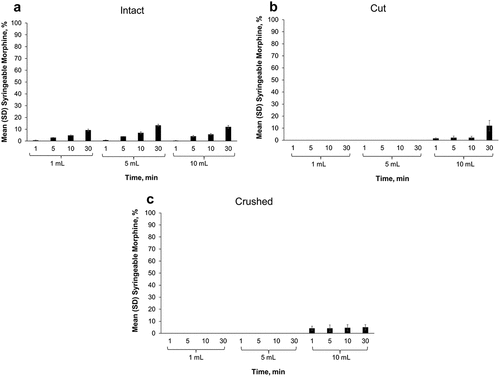
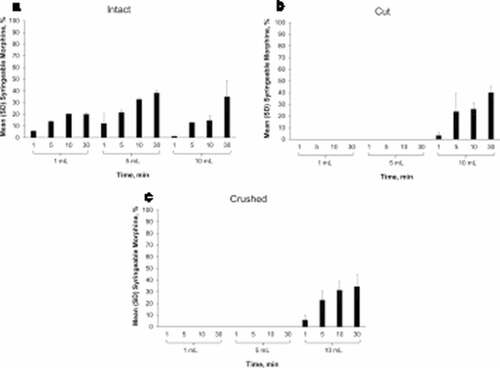
Figure 4. Mean percentage of morphine released after 1, 5, 10, and 30 min in 1 mL, 5 mL, or 10 mL 90°C water with 100 rpm agitation for (a) intact, (b) cut, or (c) crushed morphine ARER tablets. Notes: Error bars = standard deviation; ER = extended-release; rpm = revolutions per minute; SD = standard deviation.