3,338
Views
14
CrossRef citations to date
0
Altmetric
Original Articles

Associations between affect and alcohol consumption in adults: an ecological momentary assessment study

ORCID Icon, , ORCID Icon, ORCID Icon &
Pages 88-97 | Received 03 Oct 2018, Accepted 19 Jun 2019, Published online: 20 Aug 2019

Figures & data

Table 1. Descriptives for study variables

Table 2. Bivariate correlations among affect variables

Table 3. Associations between affect variables and alcohol consumption

Figure 1. (a) The intercepts (b = −.04, = .21) and slopes (b = .35, = .21) of negative affect were not significantly different before and after alcohol consumption. For comparability, the intercepts and slopes of negative affect on non-drinking days are displayed in the figure. The mean time of the first drink on drinking days was used as a transition point to split non-drinking days into “pre-drinking” and “post-drinking” periods. The dotted line indicates the time of the first alcoholic drink/transition point. Negative affect before the transition point was not significantly different from that after the transition point (intercepts_b = .09, p = .15; slopes_b = −2.18, p = .07) on non-drinking days. (b) The intercepts (b = .17, = .001) and slopes (b = −1.33, = <.001) of positive affect were significantly different before and after alcohol consumption. For comparability, the intercepts and slopes of positive affect on non-drinking days are displayed in the figure. The mean time of the first drink on drinking days was used as a transition point to split non-drinking days into “pre-drinking” and “post-drinking” periods. The dotted line indicates the time of the first alcoholic drink/transition point. Positive affect before the transition point was not significantly different from that after the transition point (intercepts_b = −.08, p = .42; slopes_b = .83, p = .64) on non-drinking days
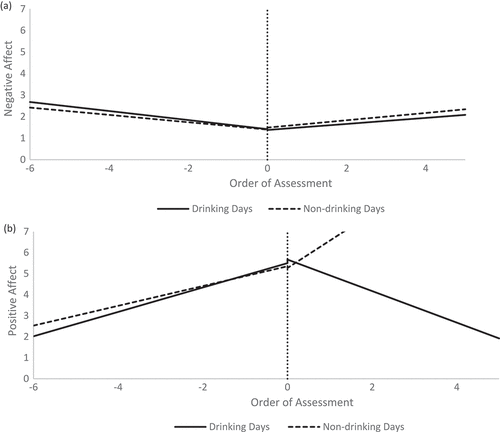
Figure 1. (a) The intercepts (b = −.04, p = .21) and slopes (b = .35, p = .21) of negative affect were not significantly different before and after alcohol consumption. For comparability, the intercepts and slopes of negative affect on non-drinking days are displayed in the figure. The mean time of the first drink on drinking days was used as a transition point to split non-drinking days into “pre-drinking” and “post-drinking” periods. The dotted line indicates the time of the first alcoholic drink/transition point. Negative affect before the transition point was not significantly different from that after the transition point (intercepts_b = .09, p = .15; slopes_b = −2.18, p = .07) on non-drinking days. (b) The intercepts (b = .17, p = .001) and slopes (b = −1.33, p = <.001) of positive affect were significantly different before and after alcohol consumption. For comparability, the intercepts and slopes of positive affect on non-drinking days are displayed in the figure. The mean time of the first drink on drinking days was used as a transition point to split non-drinking days into “pre-drinking” and “post-drinking” periods. The dotted line indicates the time of the first alcoholic drink/transition point. Positive affect before the transition point was not significantly different from that after the transition point (intercepts_b = −.08, p = .42; slopes_b = .83, p = .64) on non-drinking days
Supplemental material

Supplemental Material

Download MS Word (40.2 KB)