Figures & data
Table 1. Summary of the studies.
Figure 1. Flowchart of the study selection process.
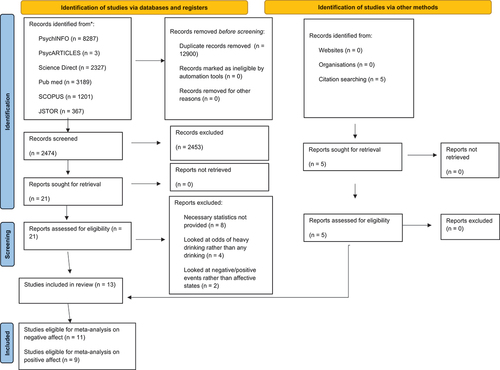
Table 2. Effect size summary.
Figure 2. Forest plot of studies examining the relationship between daily negative affect and odds of alcohol consumption. No significant association is observed between daily negative affect and odds of alcohol consumption.
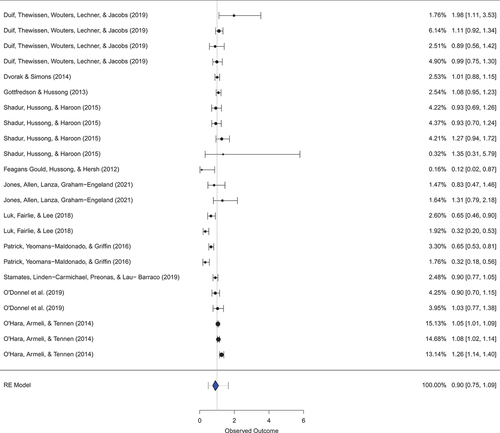
Figure 3. Forest plot of studies examining the relationship between daily negative affect and odds of alcohol consumption. Increased positive affect is associated with higher odds of drinking.
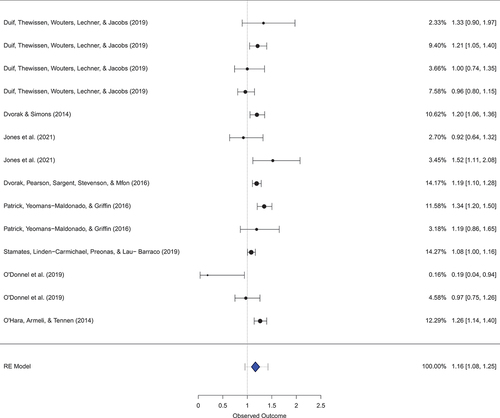
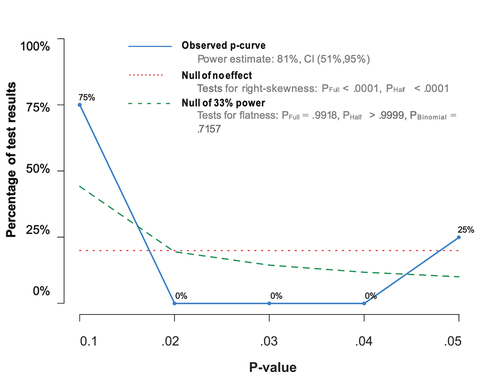
Figure 4. P-Curve analysis of studies examining the relationship between daily positive affect and odds of alcohol consumption. Most of the significant results were significant at p = .01 level, suggesting that the results are unlikely to be the product of publication bias or p-hacking alone. Note: the observed p−curve includes 8 statistically significant (p < .05) results, of which 6 are p < .025. There were 6 additional results entered but excluded from p−curve because they were p > .05.