
Figures & data
Figure 1. Flow diagram outlining procedure used to initiate buprenorphine extended-release in study participants.
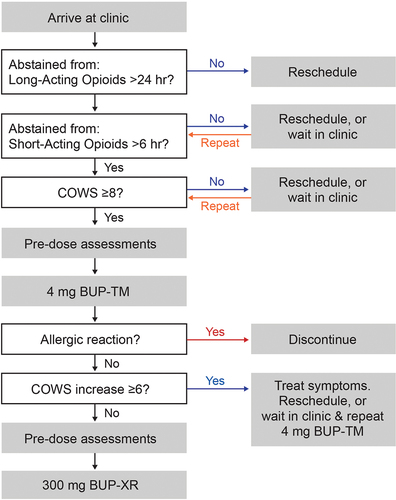
Figure 2. COHORT diagram showing disposition of study participants.
Figure 3. Clinical opiate withdrawal scale (COWS), opioid craving visual analogue scale (OC-VAS) and sedation visual analogue scale (Sedation VAS) scores over time following initiation of buprenorphine extended-release injection (BUP-XR) one hour following an initial dose of 4-mg transmucosal buprenorphine (BUP-TM). Time: D1 is check-in on the day of initiation (Day 1); PTM is prior to administration of BUP-TM; 0 h is prior to BUP-XR injection; D8, D15, D22 and D29 indicate days after buprenorphine injection. Panel A (upper left), COWS Total Score (Mean ± standard deviation [SD]) (Full Analysis Set; n = 24). A score of 0 to 4 is no active withdrawal, 5 to 12 is mild, 13 to 24 is moderate, 25 to 36 is moderately severe, and >36 is severe withdrawal. *p-value ≤0.05 based on t-test for change from PTM value. After injection, COWS scores significantly decreased from a pre-BUP-TM baseline. Panel B (upper right), COWS Total Score (Mean ± SD) by Maximum COWS Severity Subgroup (Full Analysis Set). Subgroups are based on maximum COWS total score: participants whose maximum occurred at the pre-BUP-XR (MAXpre) timepoint and those whose maximum occurred at a post-BUP-XR (MAXpost). Participants with a maximum severity post-BUP-XR injection tended to have a slower decline in withdrawal severity immediately following BUP-XR injection, but COWS scores still returned to the pre-BUP-XR average between 4 to 6 hours post-BUP-XR. Panel C (lower left), OC-VAS Score (Mean ± SD) (Full Analysis Set). *p-value ≤0.05 based on t-test for change from PTM value. A steady decrease from baseline in opioid craving was measured to 48 h post-BUP-XR and was sustained to Day 29 of treatment. Panel D (lower right),” Sedation VAS Score (Mean ± SD) (Safety Analysis Set). *p-value ≤0.05 based on t-test for change from 0 h value. Mean sedation VAS score tended to be highest between 4 to 8 hours post-BUP-XR but did not change substantially up to 36 hours post-BUP-XR.
![Figure 3. Clinical opiate withdrawal scale (COWS), opioid craving visual analogue scale (OC-VAS) and sedation visual analogue scale (Sedation VAS) scores over time following initiation of buprenorphine extended-release injection (BUP-XR) one hour following an initial dose of 4-mg transmucosal buprenorphine (BUP-TM). Time: D1 is check-in on the day of initiation (Day 1); PTM is prior to administration of BUP-TM; 0 h is prior to BUP-XR injection; D8, D15, D22 and D29 indicate days after buprenorphine injection. Panel A (upper left), COWS Total Score (Mean ± standard deviation [SD]) (Full Analysis Set; n = 24). A score of 0 to 4 is no active withdrawal, 5 to 12 is mild, 13 to 24 is moderate, 25 to 36 is moderately severe, and >36 is severe withdrawal. *p-value ≤0.05 based on t-test for change from PTM value. After injection, COWS scores significantly decreased from a pre-BUP-TM baseline. Panel B (upper right), COWS Total Score (Mean ± SD) by Maximum COWS Severity Subgroup (Full Analysis Set). Subgroups are based on maximum COWS total score: participants whose maximum occurred at the pre-BUP-XR (MAXpre) timepoint and those whose maximum occurred at a post-BUP-XR (MAXpost). Participants with a maximum severity post-BUP-XR injection tended to have a slower decline in withdrawal severity immediately following BUP-XR injection, but COWS scores still returned to the pre-BUP-XR average between 4 to 6 hours post-BUP-XR. Panel C (lower left), OC-VAS Score (Mean ± SD) (Full Analysis Set). *p-value ≤0.05 based on t-test for change from PTM value. A steady decrease from baseline in opioid craving was measured to 48 h post-BUP-XR and was sustained to Day 29 of treatment. Panel D (lower right),” Sedation VAS Score (Mean ± SD) (Safety Analysis Set). *p-value ≤0.05 based on t-test for change from 0 h value. Mean sedation VAS score tended to be highest between 4 to 8 hours post-BUP-XR but did not change substantially up to 36 hours post-BUP-XR.](/cms/asset/24866616-9f6c-4a01-a43a-27a6652cd7b3/iada_a_2106574_f0003_b.gif)
Table 1. COWS total score normalized AUC through 1, 6, 12, 24 and 48 hours post-BUP-XR 300 mg.