
Figures & data
Table 1. Patient demographics and clinical services received in the first 90 days of treatment program.
Figure 1. Trajectory of daily estimated peak BAC among patients with 90-day treatment retention.
Table 2. Growth curve model results showing significant reductions in daily estimated peak BAC over the 90 day observation period.
Figure 2. Trajectories of daily estimated peak BAC by gender among patients with 90-day treatment retention.
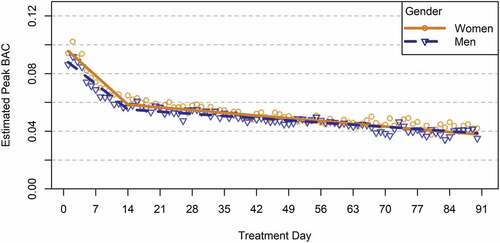
Figure 3. Trajectories of daily estimated peak BAC by treatment goal among patients with 90-day treatment retention.
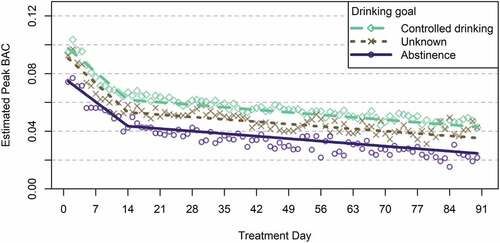
Table 3. Growth curve model results showing that changes in BAC were not significantly moderated by gender.
Table 4. Growth curve model results showing that changes in BAC were not significantly moderated by drinking goal.