
Figures & data
Figure 1. Schematic illustrations of surface enhanced Raman spectroscopy (a) and paper-spray mass spectrometer. (b) Created with BioRender.com. Adapted from Zheng and He (Citation32).
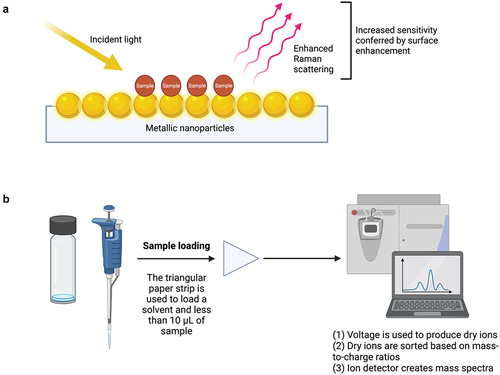
Table 1. Comparison of recently deployed point of care drug-checking technologies: Fourier-transform infrared spectroscopy, paper spray mass spectrometry, and surface-enhanced Raman spectroscopy.