Figures & data
Table 1. Sample characteristics of key variables of interest from Wave 1 to Wave 6.
Table 2. Model fit indices for longitudinal latent class analysis.
Figure 1. Longitudinal patterns of medicinal cannabis use from the selected 3-class model: Recreational Users (39.3% of the sample; low self-reported medicinal use and low-to-decreasing patient status), Recreational Patients (40.4%; low self-reported medicinal use and high-to-decreasing patient status), and Medicinal Patients (20.3%; high self-reported medicinal use and high-to-decreasing patient status). Y-axis displays the estimated probabilities of patient status and self-reported medicinal cannabis use in each class. Descriptively, findings show that patient status decreased but self-reported medicinal cannabis use remained steady in each class. W1-W6 = Waves of data collection. Four-digit year notations represent dates of data collection within each wave.
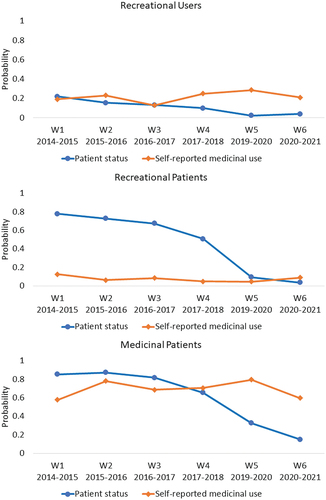
Table 3. The association of longitudinal latent classes with covariates.
Table 4. Estimated trajectories of health symptoms, cannabis use motives, and cannabis use across longitudinal latent classes.
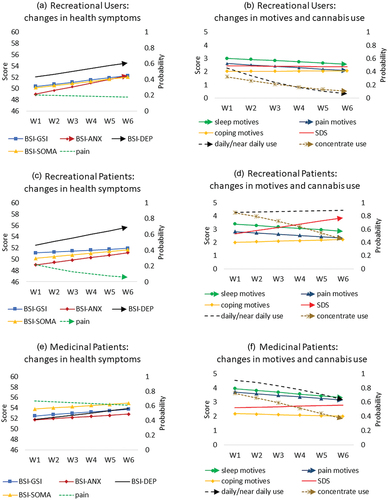
Figure 2. Trajectories of health symptoms, cannabis use motives, and cannabis use across three longitudinal latent classes: Recreational Users (39.3%), Recreational Patients (40.4%), and Medicinal Patients (20.3%). The left Y-axis displays estimated mean scores (solid lines) and the right Y-axis displays estimated probabilities (dashed lines). Trajectories with statistically significant upward or downward slopes are represented by lines ending in arrows (see for slope p-values). Findings show that between waves 1–6, depression or/and anxiety symptoms increased in recreational groups and pain decreased in Recreational Patients (panels a, c, e). Pain motives, sleep motives, and concentrate use decreased in all groups, daily/near daily use decreased in Recreational Users and Medicinal Patients, and problematic cannabis use increased in Recreational Patients (panels b, d, f). BSI-GSI = Brief Symptom Inventory - Global Severity Index; BSI-ANX = BSI-Anxiety subscale; BSI-DEP = BSI-Depression subscale; BSI-SOMA = BSI-Somatization subscale; SDS = Severity of Dependence Scale; pain = current non-minor pain; W1-W6 = Waves of data collection.