Figures & data
Figure 1. Share of EAC statements in six countries (percent, 2005–2016).
Note: Total n is 8945 statements: (Austria 818, Denmark 2350, Germany 1195, Ireland 1157, Sweden 1912 and the UK 1513). See Online Appendix E for information on which differences in proportions between countries that are significant (p-values less than 0.05).
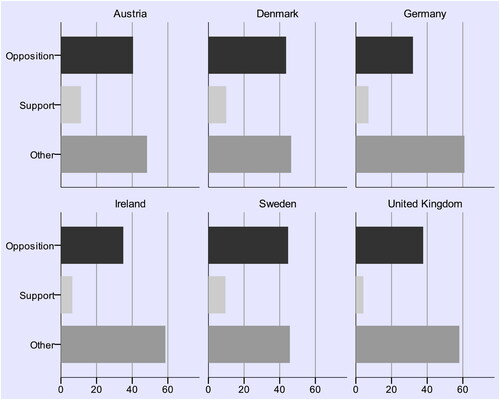
Figure 2. Share of EAC statements in six countries, by type (percent, 2005–2016).
Note: The category ‘Other’ has been excluded. Total n is 4301 statements (Austria 423, Denmark 1259, Germany 467, Ireland 479, Sweden 1038 and the UK 635). See Online Appendix E for information on which differences in proportions between countries that are significant (p-values less than 0.05).
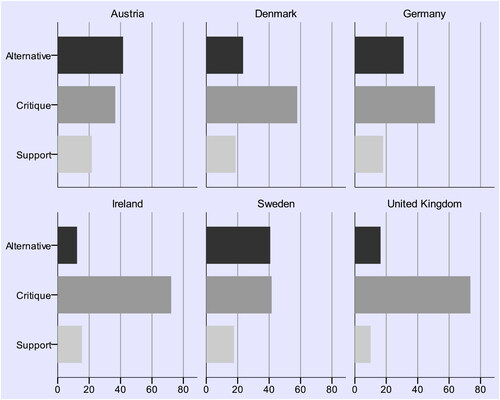
Figure 3. Share of EAC statements in six countries, by mode (percent, 2005–2016).
Note: The category ‘Other’ has been excluded. Total n is 4301 statements (Austria 423, Denmark 1259, Germany 467, Ireland 479, Sweden 1038 and the UK 635). See Online Appendix E for information on which differences in proportions between countries that are significant (p-values less than 0.05).
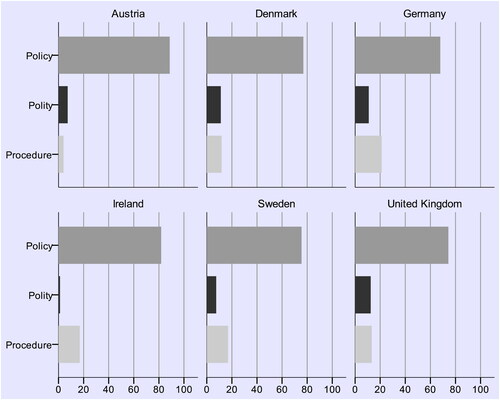
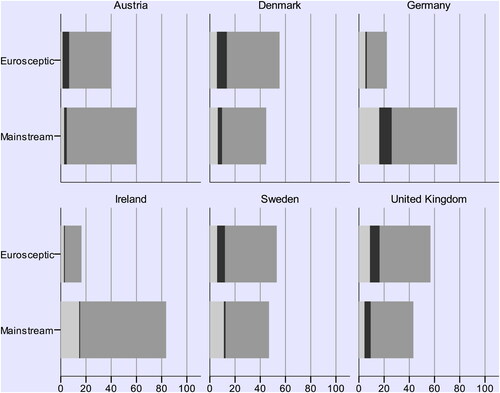
Figure 4. Share of EAC statements in six countries, by party category (percent, 2005–2016).
Note: Total n is 8942 statements (Austria 818, Denmark 2350, Germany 1193, Ireland 1156, Sweden 1912 and the UK 1513). Black refers to 'opposition', light grey to 'support' and dark grey to 'other'. See Online Appendix E for information on which differences in proportions between mainstream and Eurosceptic parties that are significant (p-values less than 0.05).
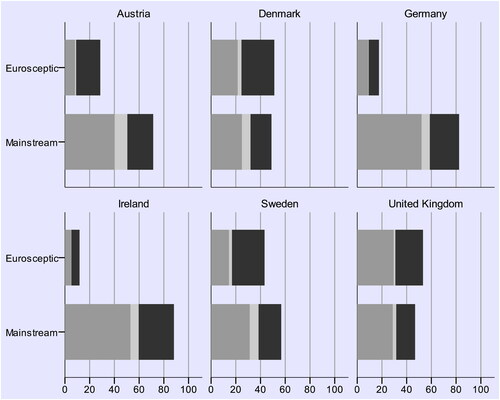
Figure 5. Share of EAC statements in six countries, by party category and type (percent, 2005–2016).
Note: The category ‘Other’ has been excluded. Total n is 4299 statements (Austria 423, Denmark 1259, Germany 465, Ireland 479, Sweden 1038, and the UK 635). Black refers to 'alternative', dark grey to 'critique' and light grey to 'support'. See Online Appendix E for information on which differences in proportions between mainstream and Eurosceptic parties that are significant (p-values less than 0.05).
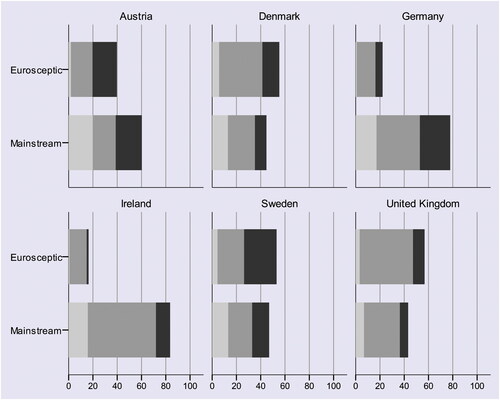
Figure 6. Share of EAC statements in six countries, by party category and mode (percent, 2005–2016).
Note: The category ‘Other’ has been excluded. Total n is 4299 statements (Austria 423, Denmark 1259, Germany 465, Ireland 479, Sweden 1038, and the UK 635). Black refers to 'polity', dark grey to 'policy' and light grey to 'procedure'. See Online Appendix E for information on which differences in proportions between mainstream and Eurosceptic parties that are significant (p-values less than 0.05).