Figures & data
Figure 1. Social democratic vote share and Gini Index, 1965–2019.
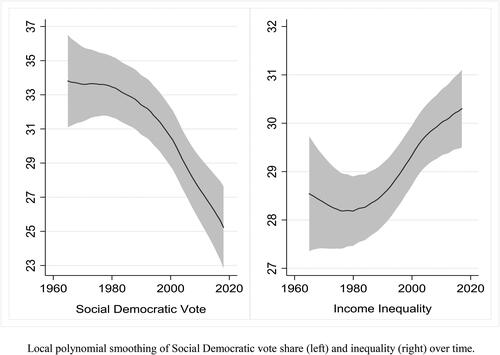
Figure 2. Social democratic vote share by country, 1965–2019.
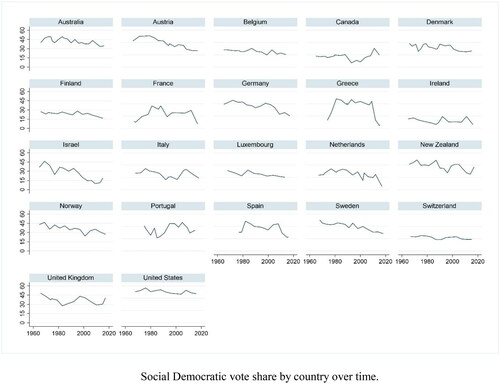
Figure 3. Social democratic economic position by country, 1965–2019.
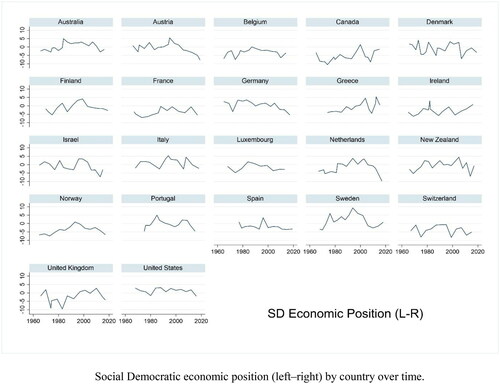
Table 1. Aggregate-level regression results predicting social democratic vote.
Figure 4. Average marginal effects of inequality by social democratic economic position on their vote with 95% C.I. (Model 2).
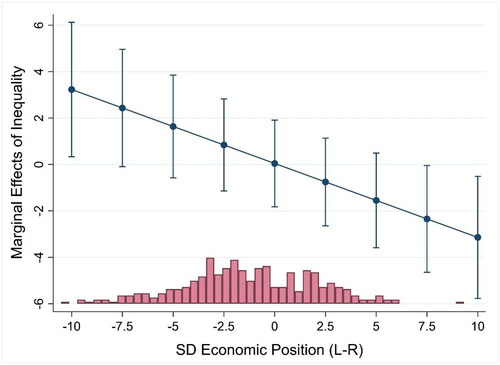
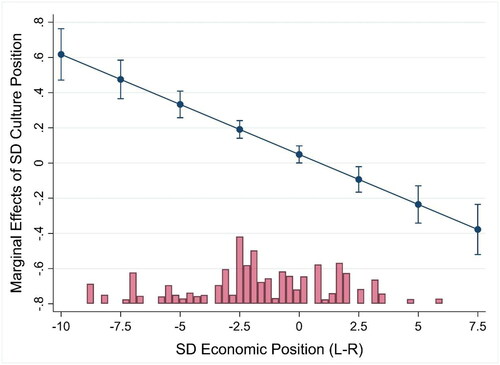
Figure 5. Average marginal effects of social democratic socio-cultural position by economic position on their vote with 95% C.I. (Model 3).
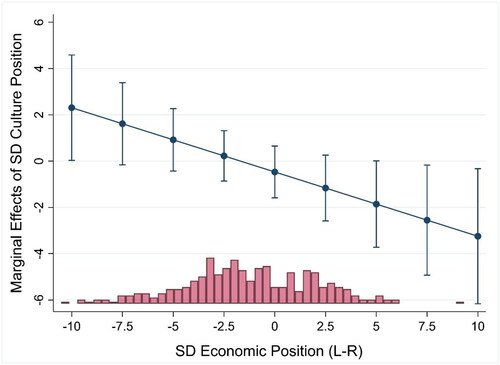
Table 2. Individual-level regression results predicting social democratic vote.
Figure 6. Average marginal effects of inequality by social democratic economic position on their vote with 95% C.I. (Model 2).
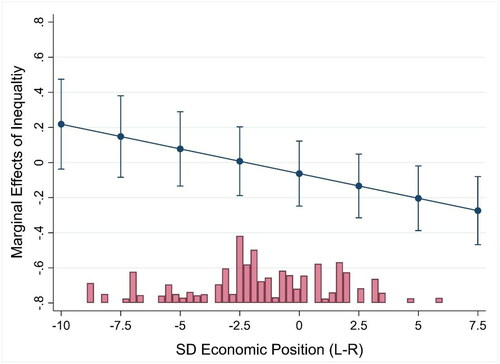
Figure 7. Average marginal effects of social democratic socio-cultural position by economic position on their vote with 95% C.I. (Model 3).