Figures & data
Table 1. Key features of studies 1 to 3.
Figure 1. Trends in key variables.
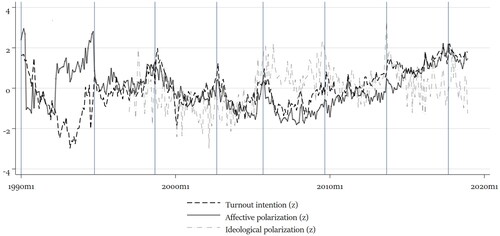
Table 2. ARIMA model predicting turnout.
Figure 2. Cumulative impulse response functions.
Note: Cumulative impact of unit change of X on Y, with 95% confidence intervals. Based on VAR-model presented in in the Online appendices.
Source: Politbarometer.
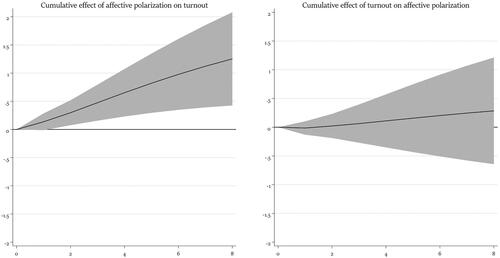
Table 3. Predicting actual turnout at bundesland elections (key coefficients).
Table 4. Lagged DV panel regression predicting (1) turnout and (2) affective polarisation.
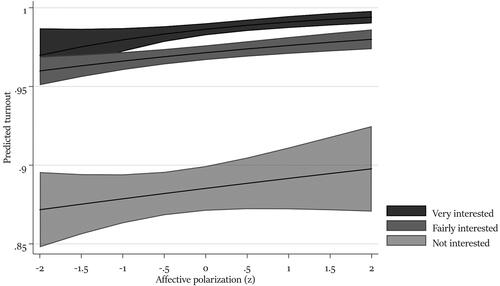
Figure 3. Effect of affective polarisation (z) on turnout intention, by political interest.
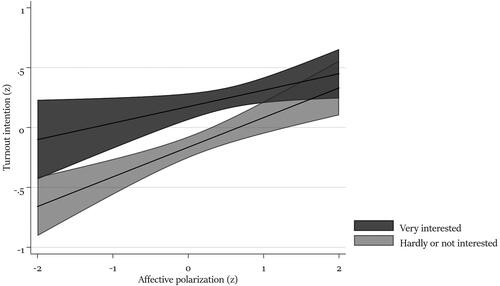
Table 5. Lagged DV panel regression predicting (1) turnout and (2) affective polarisation.
Figure 4. Effect of AP on turnout (left) and vice versa (right).
Note: Based on standardised values of affective polarisation. Based on in the Online appendices.
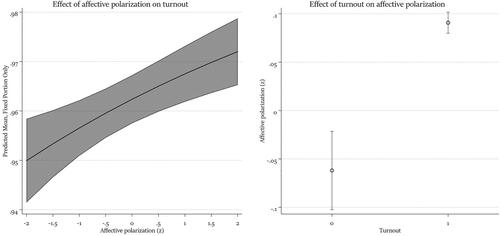
Figure 5. Interaction with political interest.