Figures & data
Figure 1. Trends in reported mask wearing.
Note: Percentage of people saying they wear masks in public spaces. Data collected by YouGov. See Online appendix B for further details.
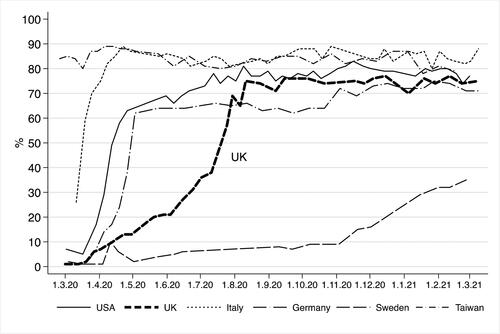
Figure 2. Mask wearing and government approval in the UK.
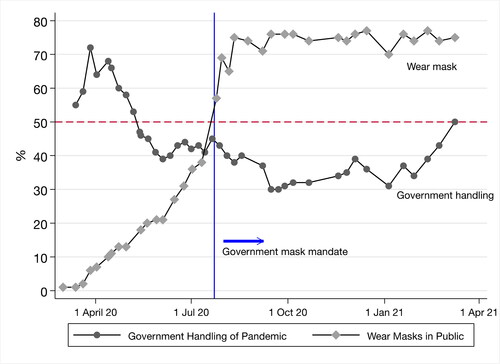
Table 1. Experimental vignettes.
Figure 3. Willingness to wear a mask (%) (In general, how willing or not are you to wear a face mask or covering in public settings?).
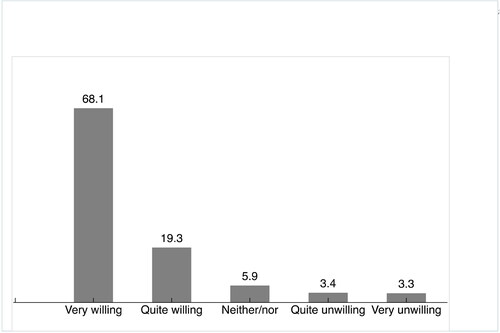
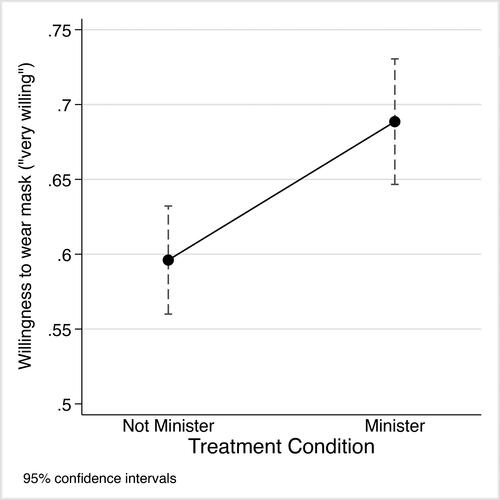
Figure 4. Willingness to wear masks across experimental conditions (Very willing to wear a mask).
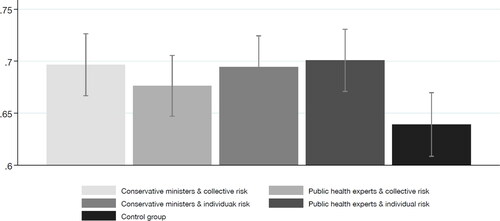
Table 2. Effects of experimental treatments on willingness to wear a mask.
Figure 5. Willingness to wear masks, by 2019 vote choice.
In general, how willing or not are you to wear a face mask or covering in public settings? (5= very willing/1 = very unwilling).
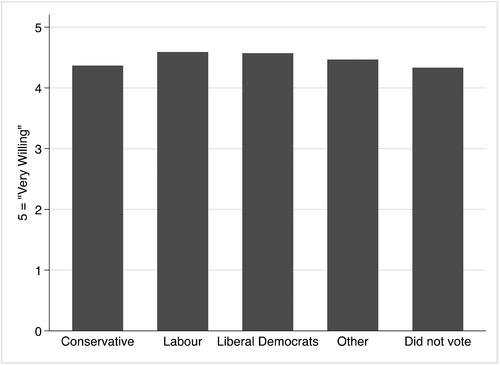
Table 3. Heterogeneous treatment effects: government support.
Figure 6. Conservative voters’ willingness to wear mask, by minister treatment.