Figures & data
Figure 1. Effect of Treatment versus Placebo (n: 3551–3828) (coefficients from OLS and two-stage least squares regressions with 95% and 90% confidence intervals). The figure displays the ITT effects from Models 1–7 and ATT effects from Models 8–14 in Table E1 in Online Appendix E.
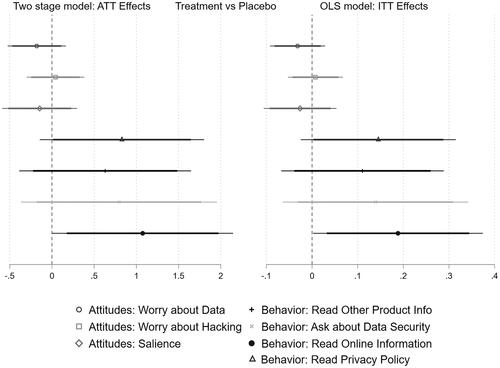
Figure 2. Effect of Coalition Treatment vs Placebo and Individual Treatment vs Placebo (n: 2226–2413) (coefficients from OLS and two-stage least squares regressions with 95% and 90% confidence intervals). The top panel displays the ITT effects from Models 1–7 and ATT effects from Models 8–14 in Table E2, and the bottom panel the ITT effects from Models 1–7 and ATT effects from Models 8–14 in Table E3 in Online Appendix E.
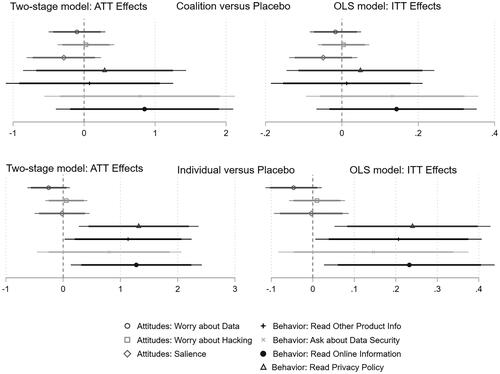
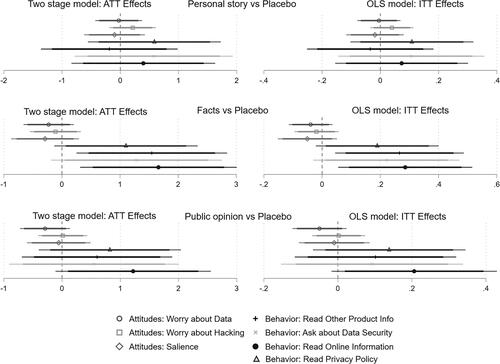
Figure 3. Effect of Different Message Types vs Placebo (n: 1771–1951) (coefficients from OLS and two-stage least squares regressions with 95% and 90% confidence intervals). The top panel displays the ITT effects from Models 1–7 and ATT effects from Models 8–14 in Table E5, the middle panel the ITT effects from Models 1–7 and ATT effects from Models 8–14 in Table E6, and the bottom panel the ITT effects from Models 1–7 and ATT effects from Models 8–14 in Table E7 in Online Appendix E.