
Figures & data
Table 1. The concept of the ‘mainstream’ in political science literature: pros and cons of different approaches.
Table 2. Bi-dimensional definition of the ‘mainstream’ in politics and societies.
Table 3. ESS items regarding populist, nativist, authoritarian, liberal- and social-democracy attitudes.
Table 4. The populist radical right on the supply side.
Figure 1. Percentage of respondents who scored above the middle of the scale on the ESS items concerning populist, nativist, authoritarian, liberal- and social-democracy attitudes, in descending order. N = 47,602–49,025.
Note: Percentages calculated using the analysis weight (anweight) available in the ESS. Descriptive statistics and percentage distributions of all variables in are reported in Appendix II.
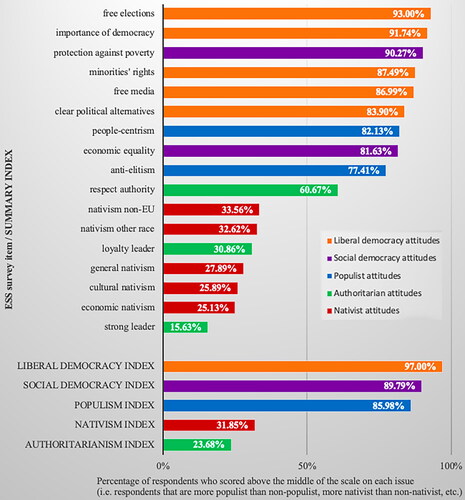
Figure 2. Boxplots and averages of the summary indexes of populist, nativist, authoritarian, liberal- and social-democracy attitudes. Comparison between supporters and non-supporters of the relevant parties.
Note: Descriptive statistics calculated using the analysis weight (anweight) available in the ESS. Red lines mark the overall means.
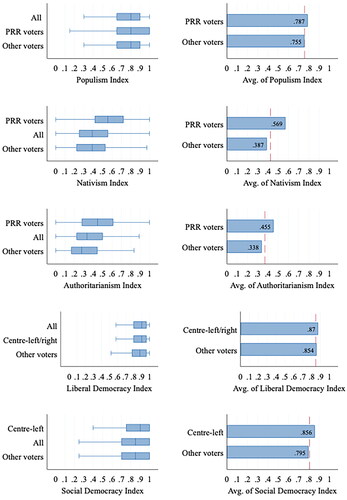
Figure 3. Coefficient plots of multilevel linear regression models explaining populist, nativist, authoritarian, liberal and social democracy attitudes in contemporary Europe.
Note: Regression models run using the analysis weight (anweight) available in the ESS. 5-95 Cis displayed.
Online Appendix V reports the full regression outputs.
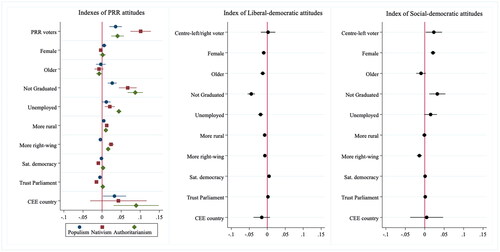
Figure 4. Robustness checks: multilevel linear regression models explaining PRR attitudes with additional controls (left-side) and multilevel linear regression models explaining different sets of authoritarian attitudes.
Note: Regression models run using the analysis weight (anweight) available in the ESS. 5-95 Cis displayed.
Online Appendix VI reports the full regression outputs.
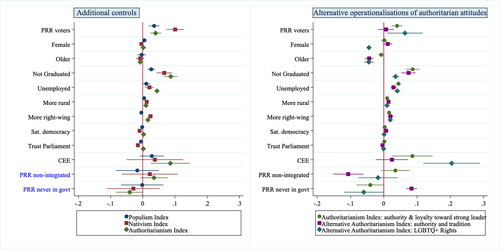
Table 5. Outcome of the comparative analysis evaluating the extent to which three political families can be considered part of the contemporary European ‘mainstream’.