Figures & data
Table 1. Main features of the curriculum and assessment program of both medical programs.
Table 2. Set of pre-defined codes, used for the initial template.
Figure 1. Outline of the study design.
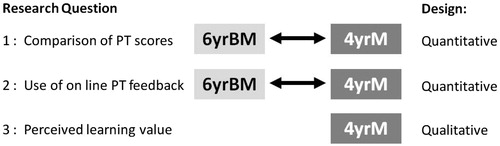
Table 3. Effect size (Cohen's d) and statistical significance for between-group score differences of students in the 4yrM and the 6yrBM programs at Maastricht University, for the total progress test and for sub-domains, in academic years 2010–2011, 2011–2012, and 2012–2013.
Figure 2. Progress test scores (formula score: percentage correct minus penalty for incorrect answers) for students of the four-year graduate-entry Master program (4yrM) and students of the (traditional) six-year bachelor–master program (6yrBM) at Maastricht University, the Netherlands. Shown are average scores per measurement moment for each program, and for the between program difference (see legend), for the total test, and for sub-domains basic sciences, clinical sciences, and scholarly topics. Scores of three academic years (2010–2011, 2011–2012, and 2012–2013), and the average over academic years are presented. Per academic year four progress tests were taken by students of all year groups resulting in scores at 6 × 4 = 24 measurement moments for the 6yrBM program. When comparing the scores of the two programs, the 16 measurement moments of 4yrM students were considered to correspond with measurement moments 9 up to 24 of the 6yrBM students.
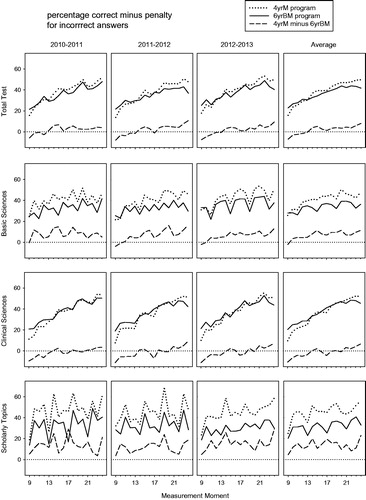
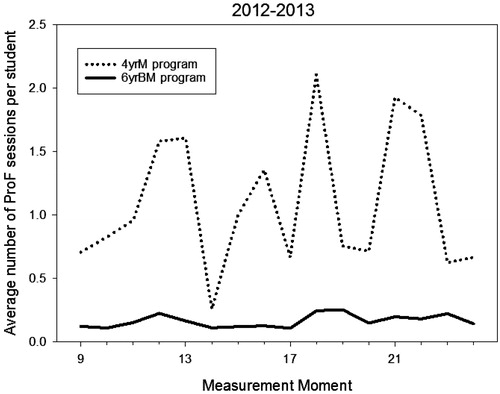
Figure 3. Use of the online Progress test feedback system (ProF) by 4yrM and 6yrBM student. Figure shows the results for measurement moments 9–24 in 2012–2013 for both programs, each point on a curve represents the average number of ProF sessions per student in the period of the progress test corresponding to the measurement moment, and the subsequent test.