Figures & data
Figure 1. 50-items Q sorting grid.
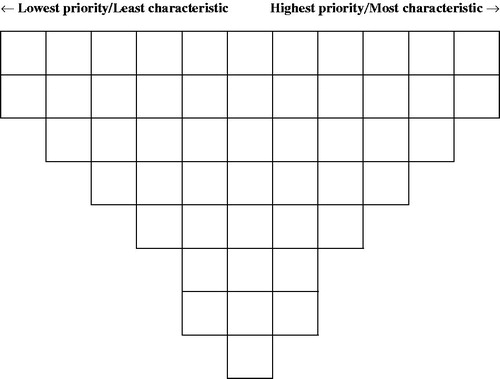
Table 1. The Q-set: themes and statements.
Table 2. Recommended procedure.
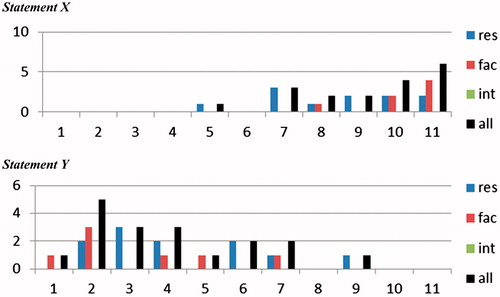
Figure 2. Group report (sample of two statements). res = residents (N = 11); fac = faculty (N = 7); int = medical students (in this example N = 0). Number of respondents placing the statement in positions 1 (most left: least characteristic) to 11 (most right: most characteristic). Black bars represent all respondents (N = 18). A complete group report contains histograms for each of the 50 statements, offering an overview of the perception of statements as relatively more (e.g. X) or less (e.g. Y) characteristic for a specific culture, and of divergence of perceptions between respondents.