
Figures & data
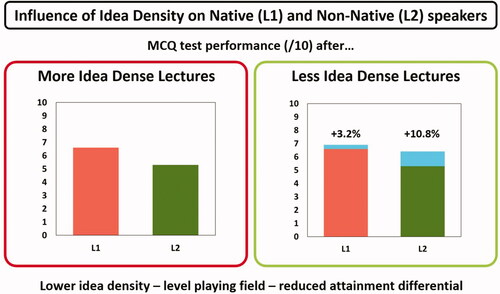
Figure 1. Overview of the research methodological flow.
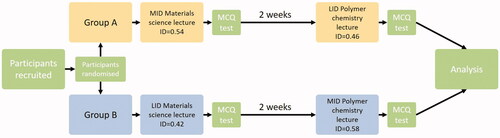
Table 1. Linguistic metrics of lectures used in the study.
Table 2. Main differences between MPL and RFB.
Figure 2. STROBE flow diagram showing study participation numbers.
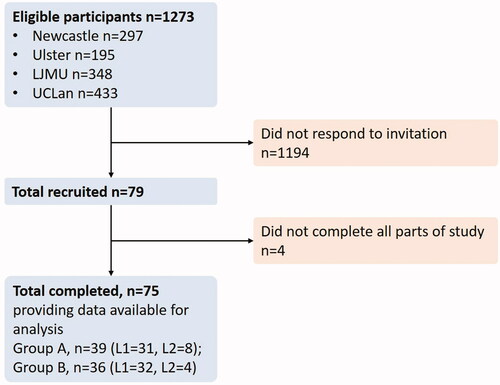
Table 3. Overall average scores achieved.
Figure 3. (A) MLP architecture with output layer neuron, (B) RBF architecture with output layer neurons. Legend: Independent variables: Gender (female, male); Language (first/second language English speaker, Age (<21, 21 and above). Dependent variables: Total score (1 = <70%, 2 = 70% and above).
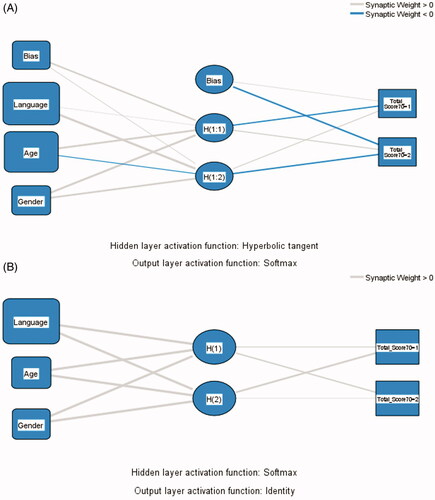
Figure 4. (A) MPL’s AUROC (0.641), (B) RBF’s AUROC (0.527).
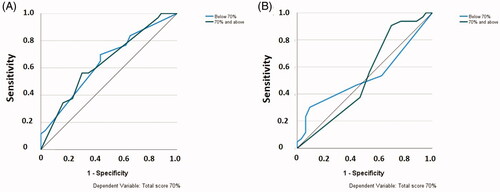
Figure 5. Average MCQ test score difference after MID and LID lectures from L1 and L2 English speakers.
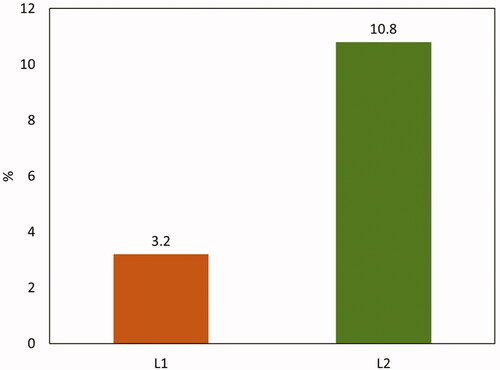
Table A1. MPL and RBF artificial neural network outputs.