
Figures & data
Figure 1. Mean scores (+95% confidence intervals) allocated to video performances by different examiner-cohorts within each school.
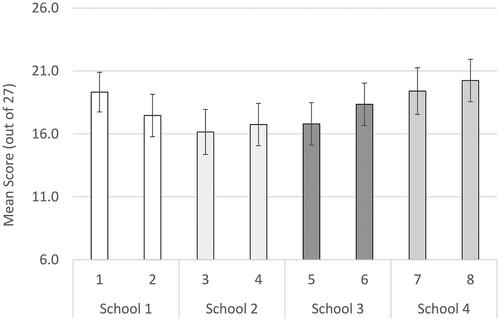
Figure 2. Mean scores (+95% confidence intervals) allocated to video performances by examiners within each school.
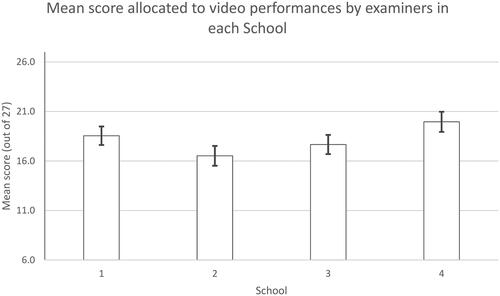
Figure 3. Boxplot of students’ score adjustments by examiner-cohort (EC), depicting minimum, 1st quartile, median, 3rd quartile, maximum.
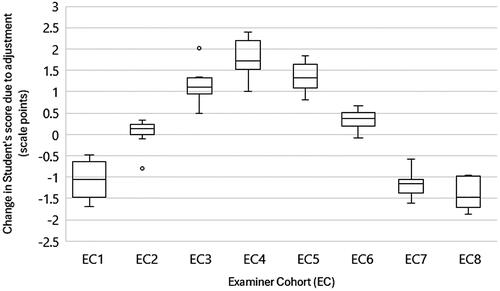
Figure 4. Relationship between students’ mean unadjusted and adjusted scores to the OSCE pass mark.
Solid black lines indicate cut score.
EC indicates examiner cohort.
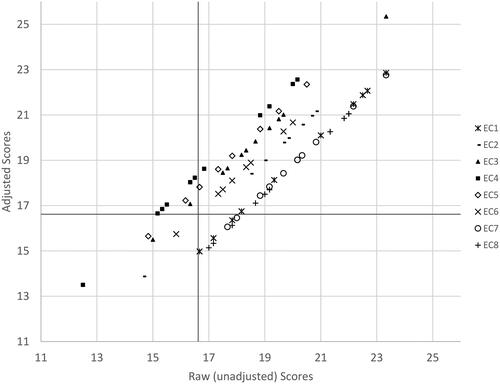
Table 1. Influence of score adjustment on students’ categorisation (pass vs. fail) and rank position in the OSCE.
Supplemental material
Supplemental Material
Download MS Word (83.2 KB)Data availability statement
Anonymous score data are available from the authors based on reasonable request.