
Figures & data
Figure 1. The locations of study cases in Enshi Tujia and Miao Autonomous Prefecture, Hubei, China.
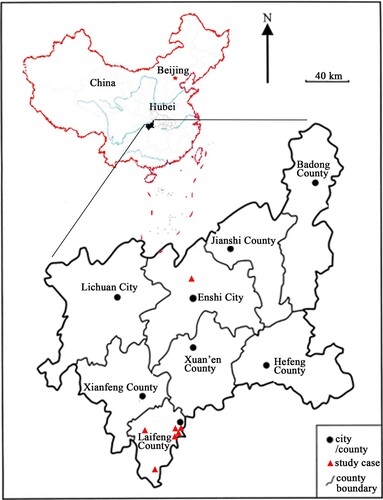
Table 1. Participants and participating schools/university.
Figure 2. Data collection procedure.
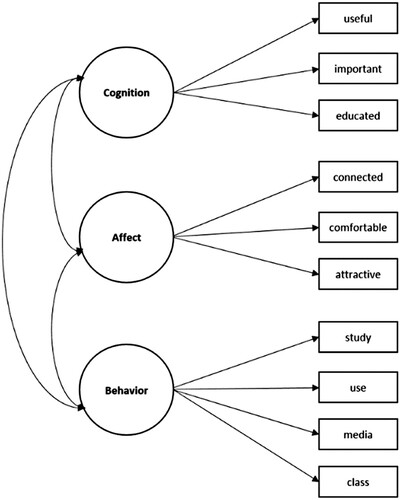
Figure 3. The conceptual structure of student attitudes towards languages. Note: T: teachers; S: students.
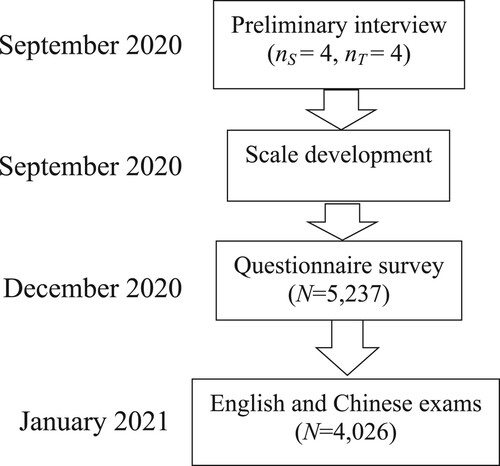
Figure 4. Attitude towards dialect: Factor structure and factor loadings (Whole sample: N = 5,237).
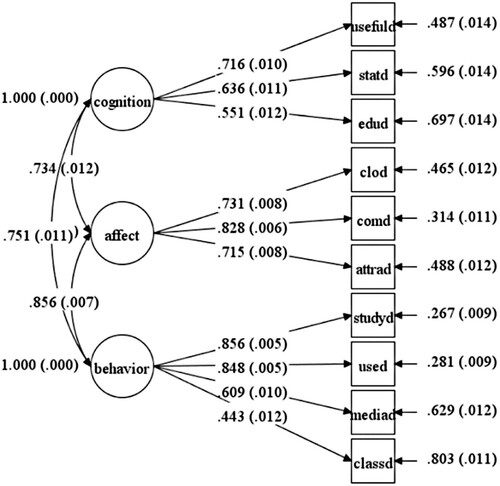
Figure 5. Attitude towards Putonghua: Factor structure and factor loadings (Whole sample: N = 5,237).
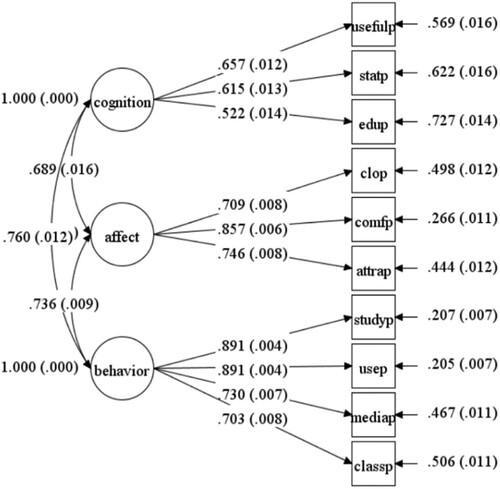
Figure 6. Attitude towards English: Factor structure and factor loadings (Whole sample: N = 5,237).

Figure 7. Attitudes towards ethnic languages: Factor structure and factor loadings (Ethnic minority participants: N = 3,410).
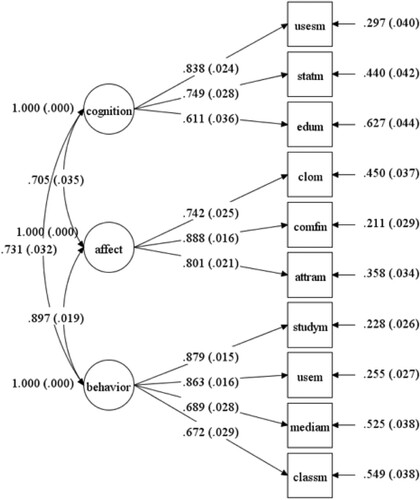
Table 2. Goodness-of-Fit Indices for the three-factor model of language attitudes.
Table 3. Correlation between items and total scales.
Table 4. Convergent validity of the Language Attitudes Scale-Student Form in relation to different languages.
Table 5. Cronbach’s Alphas of Scales and Subscales (N = 5,237).
Table 6. Correlations between language attitudes and self-perceived language proficiency (r ).
Table 7. Correlations between language attitudes and real achievement in languages (r).