
Figures & data
Table 1. Observed feature of respondents categorised by self-identified mother tongue.
Figure 1. Effect of linguistic group on educational attainment. Figure displays average difference in years of educational attainment between those that identify Akan as their mother tongue and those that belong to other linguistic groups. Dots and lines show point estimate of coefficients and their confidence intervals for Model 2 and Model 4, respectively. The thinner bar shows 99 confidence interval and the thicker one 95% confidence interval. The vertical line at 0 represent no effect size.
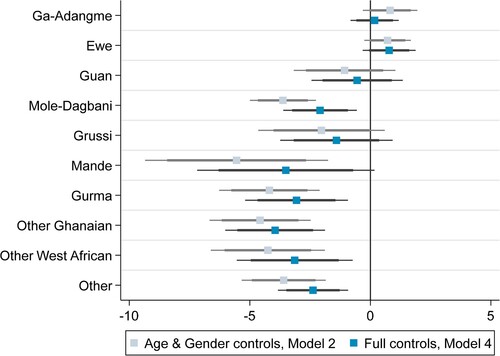
Table 2. Cross sectional models of educational attainment in years by linguistic groupTable Footnotea (defined by self-identified mother tongue).
Table 3. Labour market outcomes by linguistic group (as defined by stated mother tongue).
Figure 2. Coefficient plots for mother tongue effects on earnings, compared to the reference group Akan. Figure displays average difference in USD dollar hourly earnings between those that identify Akan as their mother tongue and those that belong to other linguistic groups. Dots and lines show point estimate of coefficients and their confidence intervals for Model 2 and Model 4. The thinner bar shows 99 confidence interval and the thicker one 95% confidence interval. The vertical line at 0 represent no effect size.
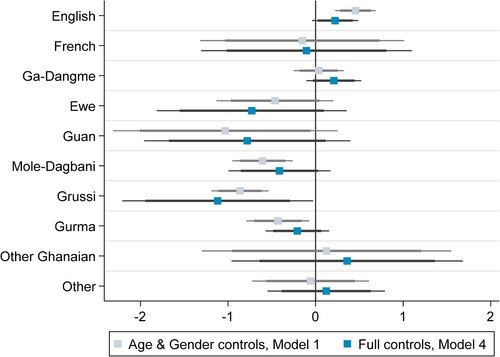
Table 4. Earnings by linguistic group (stated mother tongue).
Table 5. Languages regularly spoken for work.
Table 6. Intersection of first and second language spoken at work.
Figure 3. Language(s) regularly spoken in formal and informal work.
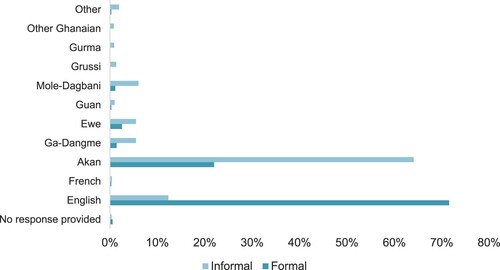
Figure 4. Language(s) regularly spoken by gender.
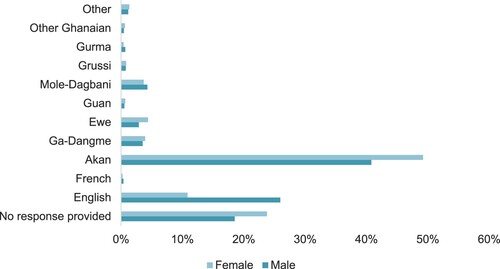
Table 7. Language use at worked weighted by hours worked in each language and the average wages associated with working in that language.
Table 8. Estimates for earnings premium of those that use English at work.