
Figures & data
Table 1. Demographic information.
Figure 1. ASL Comprehension test (ASL-CT) Scores.
Note: This figure shows the mean and distribution of ASL-CT scores in the current sample, alongside hearing ASL student group means of the ASL-CT norming study (Hauser et al. Citation2016), and another study of ASL L2 learners (Hall and Reidies Citation2021).
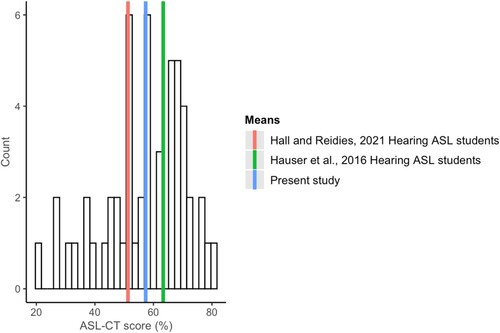
Figure 2. Expressive language sample: Common European Framework of Reference (CEFR) Scores.
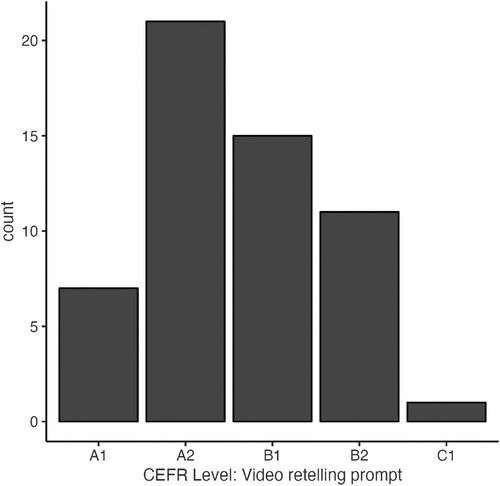
Figure 3. Expressive language sample: CEFR scores across four rubrics in video retelling prompt.
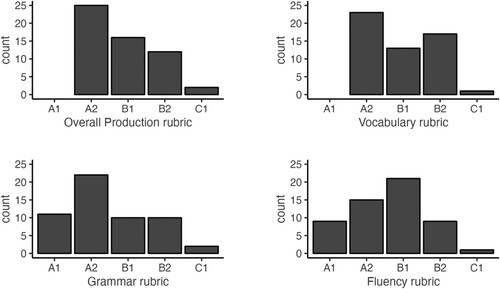
Figure 4. Correlation between ASL-CT and CEFR Score.
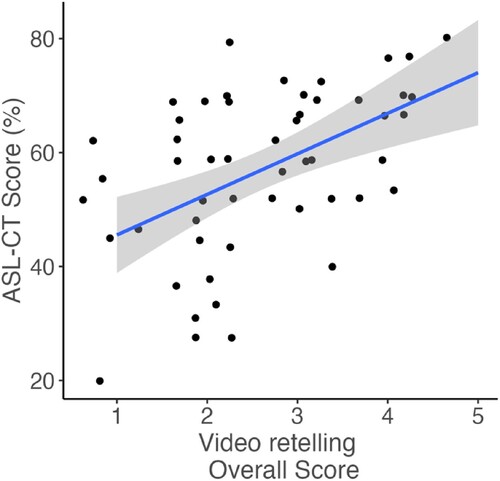
Figure 5. Second expressive language sample: common European Framework of Reference (CEFR) Scores (n = 20).
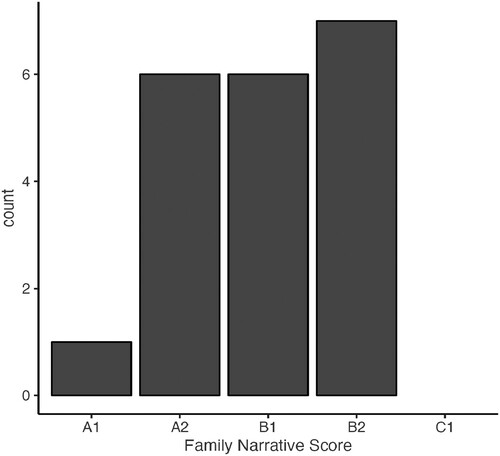
Figure 6. Expressive language sample: CEFR scores across four rubrics in family narrative prompt (n = 20).
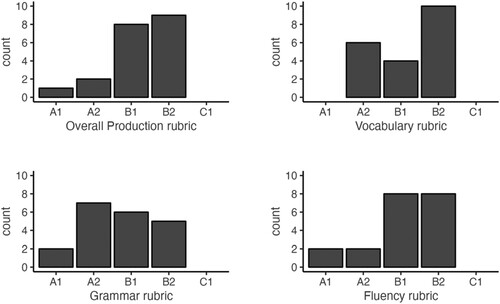
Table 2. Summary of sign type in expressive language sample
Table 3. Summary of errors in expressive language sample.
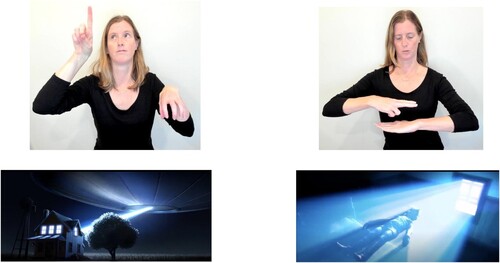
Figure 7. Classifier constructions.
Note: These images are reproduced by the authors to maintain participant anonymity. Left panel shows a classifier construction depicting the house and the location of the spaceship relative to the house. Right panel shows a classifier construction depicting the bed and the boy hovering above the bed. Still frames from Klokline Cinema (Citation2019).
Data availability statement
Derived data supporting the findings of this study are available at https://osf.io/qjmek/.