
Figures & data
Figure 1. Summary of evidence management strategy.
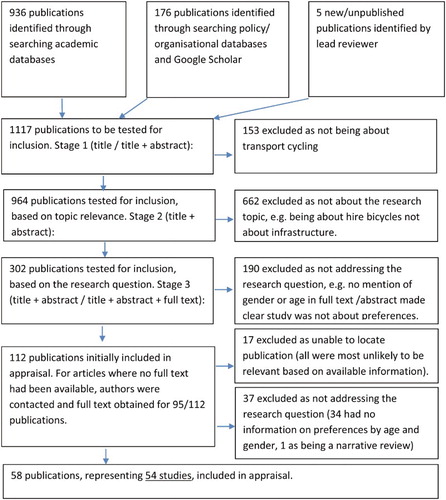
Figure 2. Articles by year.
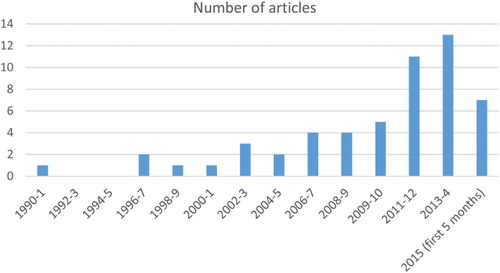
Table 1. Characteristics of included studies.
Figure 3. Gender and preferences for separated infrastructure, by sample size (minus one study with missing sample size).
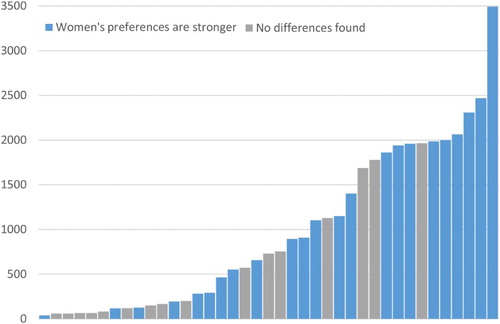
Table 2. Preferences for separated infrastructure by age and gender.
Figure 4. Age and preferences for separated infrastructure, by sample size.
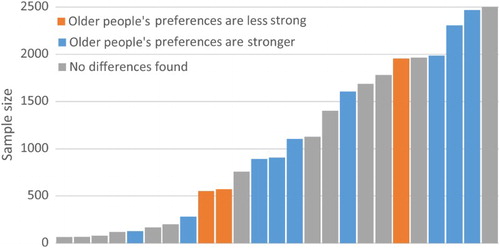
Table 3. Gender, age and infrastructure preferences.
Supplemental material